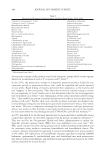
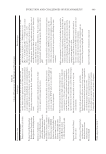
Table
IV
Perceptions
About
Irritation
Due
to
Environmental
Factors
for
Those
Claiming
Genital
Skin
Sensitivity
Sensitive
skin
in
the
genital
area
Hot
weather
Cold
weather
Rough
fabric
Dry
weather
Stress
Humid
weather
Menstrual
cycle a
≥50 Total
sensitive responders
59
59
64
60
62
60
23
Factor
causes irritation
(%)
88%
b
86%
86%
c
72%
58%
47%
30%
d
40–49 Total
sensitive responders
68
70
70
67
68
66
42
Factor
causes irritation
(%)
57%
79%
71%
73%
44%
e
39%
52%
31–39 Total
sensitive responders
256
261
255
257
256
245
229
Factor
causes irritation
(%)
64%
86%
71%
79%
62%
44%
62%
≤30 Total
sensitive responders
151
151
150
152
150
147
137
Factor
causes irritation
(%)
59%
82%
75%
76%
65%
45%
65%
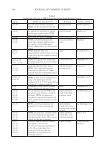
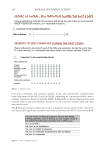
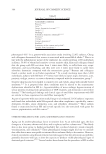
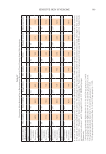
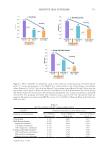
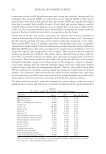
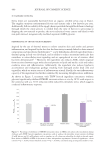
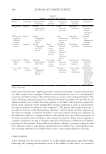
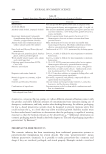
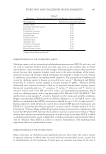
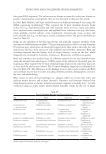
A
total
of
1,039
individuals
participated
in
the
study
on
self-reported
sensitive
skin.47Total
sensitive
responders
refer
to
the
number
of
subjects
with
skin
sensitivity
of
the
genital
area
who
responded
to
this
question.
The
percentage
of
these
responders
who
claimed
the
environmental
factor
caused
some
degree
of
skin
irritation
(i.e.,
“sometimes,”
“frequently,”
or
“always”)
is
given
in
the
following
line.
Paired
comparisons
of
age
groups
were
done
using
the
MH
chi-square
test.
Adapted
with
permission
from
references
1
and
29.
Copyright
2021
and
2017
MDPI
and
Springer.
a
Women
only.
b
≥50
age
group
significantly
higher
than
40–49,
31–39,
and
≤30
age
groups
(≤0.001).
c
≥50
age
group
significantly
higher
than
40–49,
31–39,
and
≤30
age
groups
(≤0.03).
d
≥50
age
group
significantly
lower
than
31–39
and
≤30
age
groups
(
0.02).
e
40-49
age
group
significantly
lower
than
31–39
and
≤30
age
groups
(
0.02).
369 Sensitive Skin Syndrome
IV
Perceptions
About
Irritation
Due
to
Environmental
Factors
for
Those
Claiming
Genital
Skin
Sensitivity
Sensitive
skin
in
the
genital
area
Hot
weather
Cold
weather
Rough
fabric
Dry
weather
Stress
Humid
weather
Menstrual
cycle a
≥50 Total
sensitive responders
59
59
64
60
62
60
23
Factor
causes irritation
(%)
88%
b
86%
86%
c
72%
58%
47%
30%
d
40–49 Total
sensitive responders
68
70
70
67
68
66
42
Factor
causes irritation
(%)
57%
79%
71%
73%
44%
e
39%
52%
31–39 Total
sensitive responders
256
261
255
257
256
245
229
Factor
causes irritation
(%)
64%
86%
71%
79%
62%
44%
62%
≤30 Total
sensitive responders
151
151
150
152
150
147
137
Factor
causes irritation
(%)
59%
82%
75%
76%
65%
45%
65%
A
total
of
1,039
individuals
participated
in
the
study
on
self-reported
sensitive
skin.47Total
sensitive
responders
refer
to
the
number
of
subjects
with
skin
sensitivity
of
the
genital
area
who
responded
to
this
question.
The
percentage
of
these
responders
who
claimed
the
environmental
factor
caused
some
degree
of
skin
irritation
(i.e.,
“sometimes,”
“frequently,”
or
“always”)
is
given
in
the
following
line.
Paired
comparisons
of
age
groups
were
done
using
the
MH
chi-square
test.
Adapted
with
permission
from
references
1
and
29.
Copyright
2021
and
2017
MDPI
and
Springer.
a
Women
only.
b
≥50
age
group
significantly
higher
than
40–49,
31–39,
and
≤30
age
groups
(≤0.001).
c
≥50
age
group
significantly
higher
than
40–49,
31–39,
and
≤30
age
groups
(≤0.03).
d
≥50
age
group
significantly
lower
than
31–39
and
≤30
age
groups
(
0.02).
e
40-49
age
group
significantly
lower
than
31–39
and
≤30
age
groups
(
0.02).
369 Sensitive Skin Syndrome