367 Sensitive Skin Syndrome
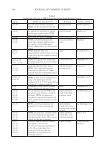
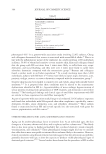
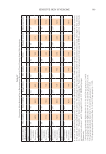
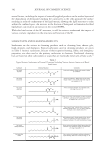
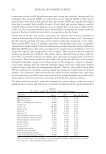
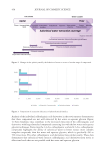
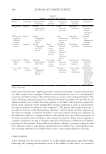
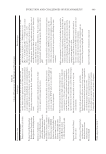
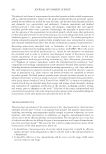
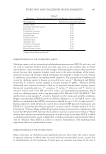
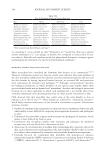
Table III
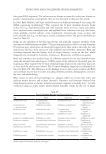
Reported Environmental and Lifestyle Triggers of SSS
SSS subjects Nonsensitive subjects p value Ref
Total
responding
Factor causes
irritation (%)
Total
responding
Factor causes
irritation (%)
Environmental
Humid weathera 641 48% 295 13% 0.0005 47
Dry weathera 664 78% 297 54% 0.0005
Hot weathera 659 66% 295 32% 0.0005
Cold weathera 675 87% 303 70% 0.0005
Suna 673 82% 306 66% 0.0005
Winda 654 71% 292 53% 0.0005
Air conditioningb 63 13% 22 5% 0.001 33
Temperature variationb 210 47% 104 19% 0.001
Wate b 69 15% 33 6% 0.001
Pollutionb 3,249 63% 1,823 33% 0.001 48
Dus b 2,990 58% 1,633 29% 0.001
Lifestyle and habits
Rough fabricsa 666 71% 293 43% 0.0005 47
Cosmeticsb 2,989 58% 1,250 22% 0.001 48
Sweatingb 2,814 54% 1,496 27% 0.001
Tobacco smokeb 2,055 40% 1,135 20% 0.001
Foodb 2,262 44% 950 17% 0.001
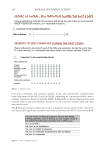
Potential triggers of SSS symptoms were included from a number of sources, as indicated. Statistical analyses
compared individuals with SSS to individuals with nonsensitive skin by methods described in the appropriate
references.
a Subjects with SSS include individuals with any degree of sensitivity (very, moderate, slight).
b Subjects with SSS include only individuals with very or moderate sensitivity.
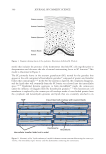
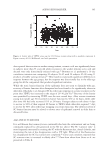
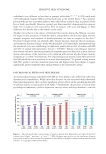
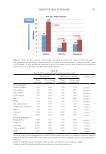
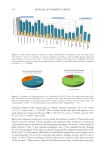
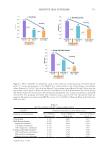
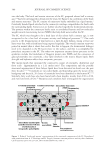
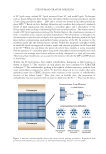
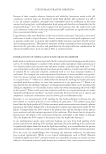
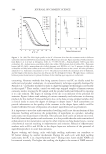
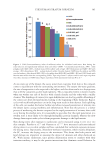
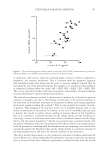
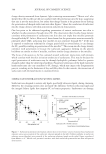
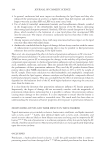
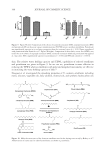
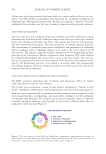
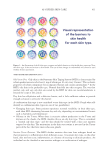
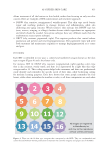
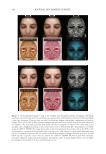
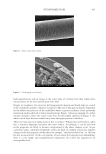
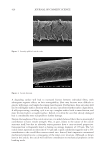
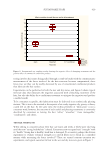
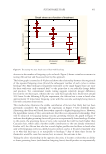
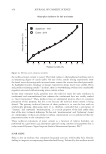
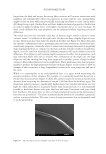
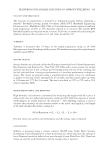
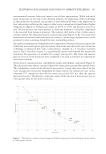
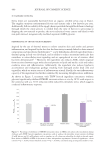
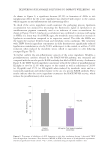
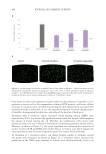
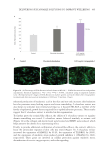
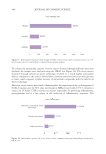
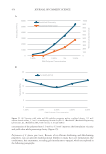
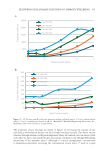
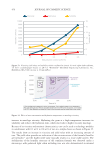
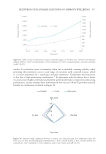
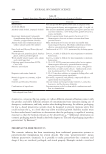
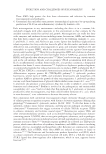
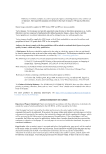
Figure 2. BoSS. Authors used the 14-item BoSS instrument to evaluate the impact of SSS on the QoL.7,46
The instrument evaluated three dimensions (Self-Care, Daily Life, and Appearance). Subjects included a total
of 100 women, 59 with self-declared sensitive skin and 41 without sensitive skin. Adapted with permission
from reference 46. Copyright 2021 Medical Journals Sweden.
Table III
Reported Environmental and Lifestyle Triggers of SSS
SSS subjects Nonsensitive subjects p value Ref
Total
responding
Factor causes
irritation (%)
Total
responding
Factor causes
irritation (%)
Environmental
Humid weathera 641 48% 295 13% 0.0005 47
Dry weathera 664 78% 297 54% 0.0005
Hot weathera 659 66% 295 32% 0.0005
Cold weathera 675 87% 303 70% 0.0005
Suna 673 82% 306 66% 0.0005
Winda 654 71% 292 53% 0.0005
Air conditioningb 63 13% 22 5% 0.001 33
Temperature variationb 210 47% 104 19% 0.001
Wate b 69 15% 33 6% 0.001
Pollutionb 3,249 63% 1,823 33% 0.001 48
Dus b 2,990 58% 1,633 29% 0.001
Lifestyle and habits
Rough fabricsa 666 71% 293 43% 0.0005 47
Cosmeticsb 2,989 58% 1,250 22% 0.001 48
Sweatingb 2,814 54% 1,496 27% 0.001
Tobacco smokeb 2,055 40% 1,135 20% 0.001
Foodb 2,262 44% 950 17% 0.001
Potential triggers of SSS symptoms were included from a number of sources, as indicated. Statistical analyses
compared individuals with SSS to individuals with nonsensitive skin by methods described in the appropriate
references.
a Subjects with SSS include individuals with any degree of sensitivity (very, moderate, slight).
b Subjects with SSS include only individuals with very or moderate sensitivity.
Figure 2. BoSS. Authors used the 14-item BoSS instrument to evaluate the impact of SSS on the QoL.7,46
The instrument evaluated three dimensions (Self-Care, Daily Life, and Appearance). Subjects included a total
of 100 women, 59 with self-declared sensitive skin and 41 without sensitive skin. Adapted with permission
from reference 46. Copyright 2021 Medical Journals Sweden.