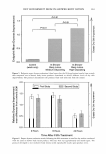
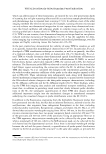
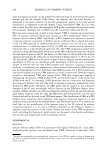
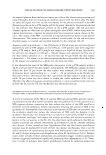
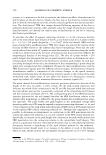
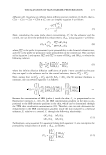
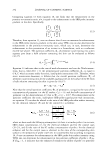
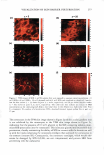
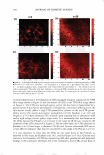
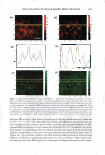
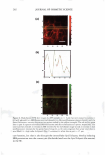
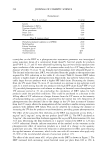
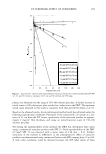
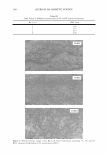
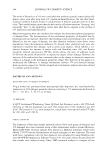
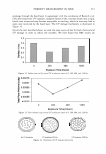
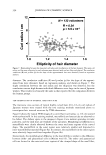
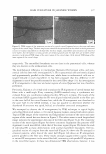
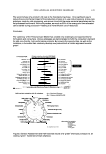
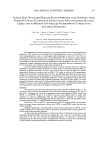
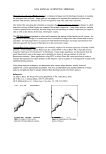
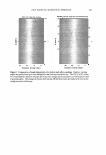
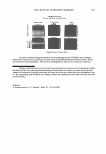
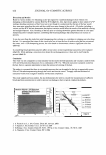
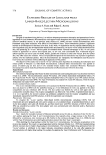
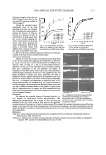
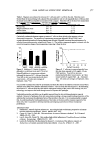
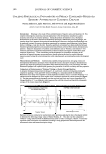
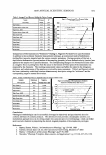
2008 ANNUAL SCIENTIFIC SEMINAR 357 Hematoxylin and eosin (H&E) staining is a common technique used in histological analysis to examine the biological state of tissue. Image analysis was employed to separate the contribution of each stain, monitor stain intensity, measure the 2D area occupied by each stain, and count cell nuclei. One method for analyzing skin whitening or tanning is the Fontana-Masson staining technique in which transverse sections of skin biopsies are examined for melanin expression. Using image analysis, melanin content is quantified by measuring the total image area corresponding to melanin expression per length of skin as well as the density of the stain. See Figures 1 and 2. The Oil Red staining experiment is often used to measure the amount of lipid matter in cell cultures. An application of this technique is to monitor the level of stored fat in adipocytes when treated with an active ingredient. Several image filters in conjunction with threshold techniques and image segmentation were utilized to quantify the amount of lipid present in the microscopic image. Imrnunofluorescent staining techniques are commonly employed to monitor expression of certain cellular proteins. As an example, a green fluorescent dye, such as FITC or Alexa Fluor 488, is typically used to image the expression of Cytochrome C in fibroblasts. Using image algorithms, we demonstrate how the green fluorescence seen in the image can be quantified in terms of area per number of cells and fluorescence intensity. Other applications, using FITC or Alexa Fluor 488, were carried out in order to measure the expression of certain proteins in skin biopsies, such as Laminin V or Collagen IV located in the epidermal-dermal junction. Using image analysis techniques, we demonstrate how various image features, usually observed qualitatively, can be appropriately quantified. This was accomplished using standard methods of image analysis and applying them to images obtained from histological and cell culture analysis. References: [1] John C. Russ, The Image Processing Handbook, 4111 Ed., CRC Press, 2002. [2] Y. Hu et al., J. Immun. Meth,, 290: 93-105 (2005). [3] K. Matkowskyj et al., J. Histochem. Cytochem., 51: 205-214 (2003). Figure 1. Image of a skin section subjected to Fontana Masson staining. Figure 2. Segmentation of the image shown in Figure 1.

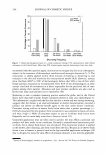
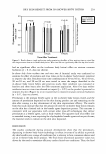
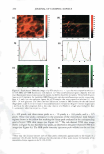
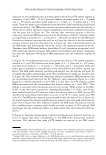
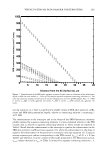
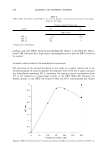
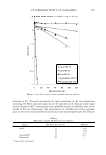
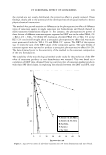
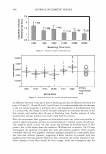
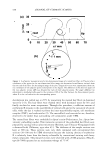
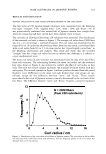
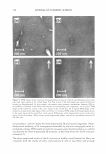
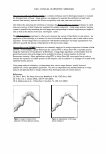
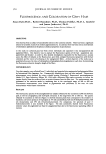
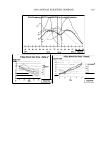
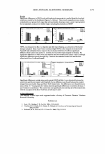
358 JOURNAL OF COSMETIC SCIENCE FLUORESCENCE AND COLORATION OF GREY HAIR Susan Daly1,Ph.D., Robert Bianchini1, Ph.D., Thomas Polefka1, Ph.D. L. Jwnbelic1 and Janusz Jachowicz2, Ph.D. OBJECTIVE 1 Johnson &Johnson, Consumer Products Division, Skillman, NJ 2 Better Cosmetics, LLC Grey hair has been a subject of considerable interest in the cosmetic industry. There has been a significant amount of scientific research on melanin pigmentation [I]. In contrast, there has been only a small amount of information published on the physico-chemical properties of grey hair [2]. In this study we collected gray hair from eleven individuals and separated it into non-pigmented and pigmented fibers. Our objective was to analyze the fluorescence spectra of the hair - pigmented, non pigmented, and blended - in order to, first, identify chromphores responsible for the fluorescence, second, assess the effect of melanin on the fluorescence, and, third, compare fluorescence properties with the hair coloration and the extent of yellowing in the unpigmented fibers. A final objective of the study was to quantitatively assess the rates of chromophore (tryptophan) photo-degradation in each tress by monitoring the fluorescence intensity along the length of the fibers. METHODOLOGY Grey hair samples were collected from 11 individuals and separated into unpigmented and pigmented fibers by International Hair Importers, Inc. Commercially blended grey hair was also analyzed. Fluorescence measurements were obtained by using a double grating Fluorolog-2 fluorescence spectrophotometer (Model 212, Spex Industries, Edison, NJ, USA) and a bifurcated fiber optics accessory to collect the spectra directly from the surface of hair at various distances from the fiber root. The measurements were performed in the emission mode by irradiating hair in the wavelength range of 260 to 400 nm. Fluorescence measurements were related to pigmentation and yellowness of the tress via color measurements with a Hunter colorimeter. RESULTS The fluorescence spectra of the un-pigmented hair samples obtained by the excitation at 290 nm showed a peak at 356 nm (tryptophan), and multi-peak emissions in the range from 395 to 500 nm. The spectra obtained by excitation at 320 nm (Figure I) showed emission peaks that correspond to the oxidative or metabolic conversion products of tryptophan at 395 nm (unidentified), 420 nm (N-formylkynurenine), 460 nm (kynurenine), and 495 nm (3-hydroxykynurenine). For comparison, the spectrum of pure 3- hydroxykynurenine is also included in the figure. The data consistently showed lower fluorescence intensity values for pigmented hair than for unpigmented hair due to the fluorescence quenching effect of melanin.
Purchased for the exclusive use of nofirst nolast (unknown)
From: SCC Media Library & Resource Center (library.scconline.org)