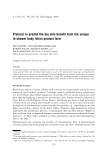
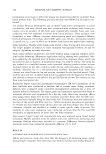
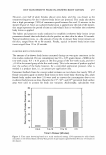
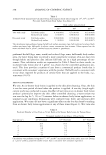
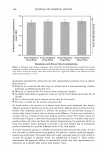
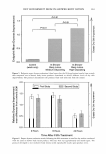
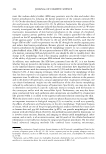
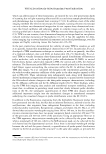
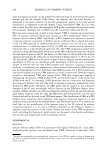
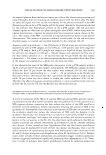
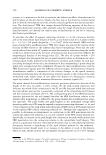
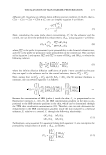
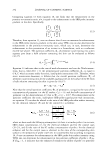
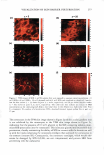
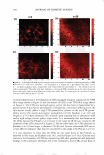
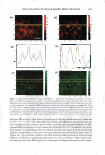
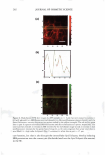
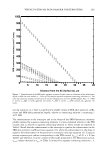
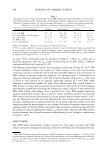
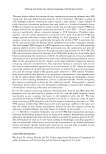
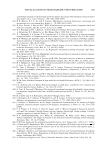
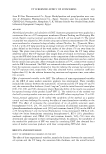
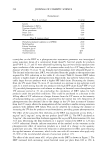
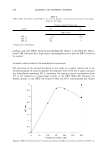
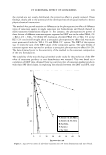
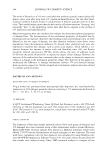
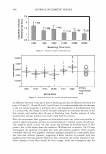
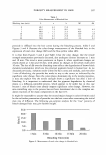
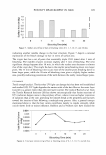
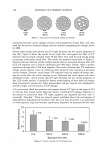
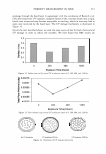
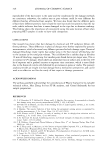
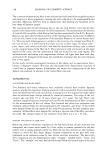
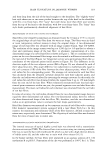
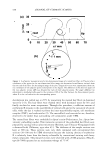
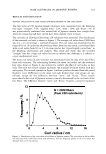
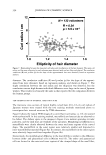
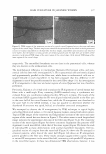
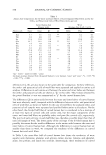
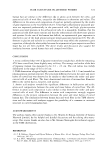
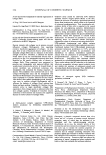
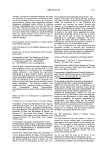
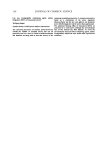
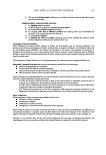
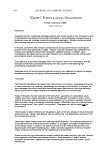
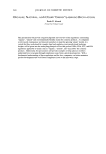
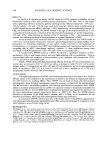
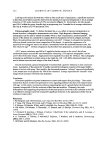
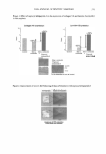
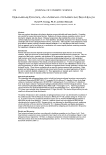
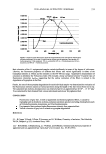
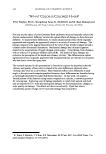
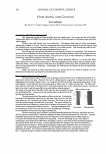
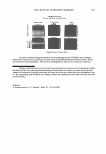
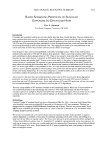
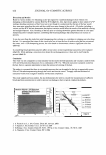
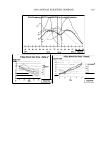
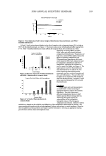
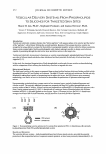
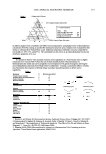
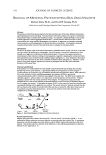
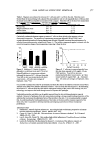
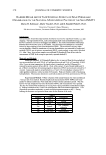
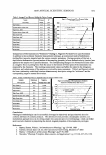
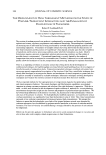
.i::: bJ) UV SCREENING EFFECT OF SUNSCREENS 1.5 1 0.5 0 20 40 60 •Luna SPF 12 ♦ LtmaSPF 27 ■ LtmaSPF 35 x SpectraBAN SPF 55 • Photodenn SPF 100 80 100 120 Exposw·e time, min Figure 3. Log survivor plots of some marketed sunscreen products. 297 increased to 6%. Physical investigation by light microscopy of the test formulation containing 6% BZ-3 indicated separation of the sunscreen in the form of needle shape crystals (Figure 4). BZ-3 concentration most probably exceeds its solubility limit in the vehicle of this test formulation. The phenomenon of crystallization of the sunscreen agent in relatively concentrated formulations has been reported previously (18). Because Table II DRT Values of Some Marketed Sunscreen Products Product Luna® SpectraBAN® Photoderm® * Could not be determined. SPF label claim (in vivo) 12 27 35 55 100 DRT (h) 0.06 1.90 3.10 10.6 *

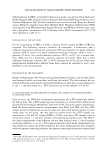
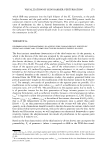
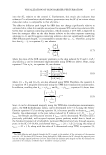
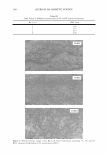
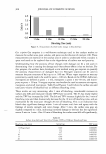
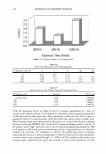
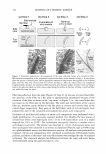
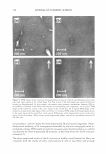
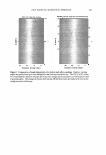
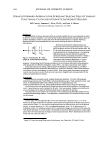
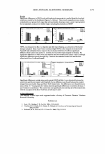
298 JOURNAL OF COSMETIC SCIENCE Table III DRT Values of Different Concentrations of BZ-3 0/W Lotion Formulations BZ-3 (%) DRT (min) 1.36 2 3.12 3 6.14 6 6.30 Figure 4. Photomicroscopic images of test BZ-3 o/w lotion formulations containing 1 %, 3%, and 6% BZ-3, showing crystallization at 6% concentration (200x).
Purchased for the exclusive use of nofirst nolast (unknown)
From: SCC Media Library & Resource Center (library.scconline.org)