454 JOURNAL OF COSMETIC SCIENCE
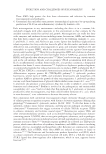
was extracted using a TriPure Isolation Reagent® (Sigma-Aldrich, St. Louis, MO, USA)
according to the protocol recommended by the supplier. The quantity and quality of the
RNAs were evaluated by capillary electrophoresis (Bioanalyzer 2100, Agilent, Santa Clara,
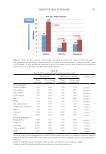
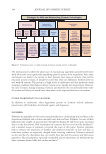
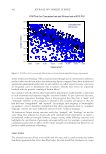
CA, USA). Gene expression was measured using a DNA microarray technique. A full
transcriptomic analysis (Affymetrix, Santa Clara, CA, USA) was developed by the external
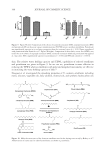
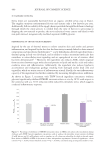
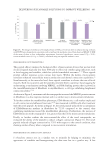
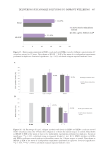
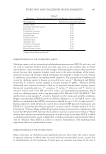
company Bioalternatives SAS. The “fold change” thresholds (value corresponding to the
ratio: signal intensity value of a probe corresponding to the processed sample divided
by the signal intensity value of a probe corresponding to the control) have been defined
and applied to standardized data to filter more relevant upregulated and downregulated
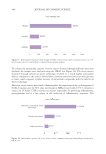
genes. The percentage of fold change values are represented for selected genes. The studied
genes for antioxidant response were as follows: HMOX1 (heme oxygenase-1), TXNRD1
(thioredoxin reductase) and OSGIN-1 (oxidative stress induced growth inhibitor 1). These
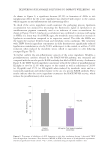
genes were found in fibroblasts treated with 1.1% S rebaudiana extract. Studied genes for
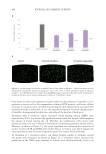
evaluating inflammatory response were PTGS2 (Prostaglandin-endoperoxide synthase 2,
also known as COX-2) in keratinocytes treated with 0.37% S rebaudiana extract.
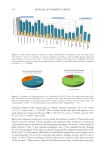
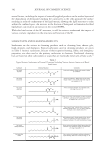
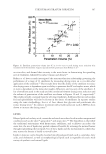
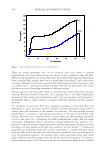
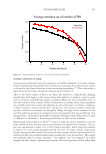
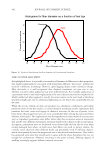
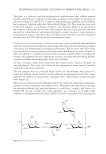
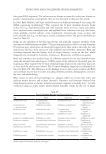
ORAC METHOD: TEAC ASSAY
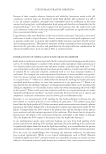
The oxygen radical absorbance capacity (ORAC) method evaluates the ability of antioxidants
in a sample to limit the oxidation of fluorescein, a fluorescent probe that is sensitive to
oxidation, by generated peroxyl radicals by a thermolabile oxidizing compound (AAPH).
The oxidation of fluorescein is accompanied by a decrease in fluorescence measured over
time (excitation is 485 nm, emission is 520 nm). The antioxidant compounds involved in
this reaction thus limit, at least for a time, the loss of fluorescence. The sample’s antioxidant
potential is determined by the difference in area under the curve with the area under
the curve of a control without antioxidants. The antioxidant potential is expressed in a
concentration that is equivalent to an antioxidant of reference (Trolox), where 1 ORAC unit
is equivalent to 1 µmol of Trolox per g or per 100 g (extracts and fruits) or 1 µmol of Trolox
per µmol of pure compound.
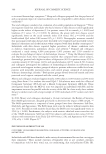
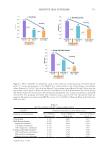
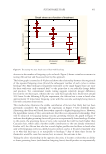
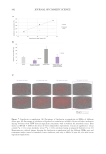
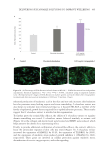
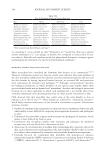
INHIBITION OF INTERLEUKIN 6 (IL-6) RELEASE IN HUMAN EPIDERMAL KERATINOCYTES
HEKa were seeded in a 96-well black plate (PerkinElmer, Inc., Waltham, MA, USA) in
culture medium. After 24 hours of incubation at 37°C in 5% CO
2 humidified air, the
medium was removed and keratinocytes were treated with the proinflammatory TNF-α
at 0.25 ng/mL, which shows an inflammatory effect with an increase in IL-6 levels this
medium was then used as a positive control. Keratinocytes were also treated with the
combination of TNF-α and either 0.05 µg/mL retinoic acid, 0.005% S rebaudiana extract,
or 0.005% bakuchiol. Cells treated with the medium alone were used as a control. After
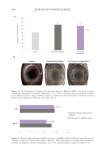
48 hours of incubation, all supernatants were collected and kept at -20°C until they were
analyzed by ELISA for interleukin-6 protein (Thermo Fisher Scientific, Waltham, MA,
USA) following the provider’s instructions. These results were normalized with the total
viable cell number for each condition calculated by the PrestoBlueTM staining assay (Thermo
Fisher Scientific, Waltham, MA, USA). The obtained values were normalized compared
to the control and represent the mean of three independent experiments performed in
triplicates. The statistical analysis used was the unpaired student’s t test.
was extracted using a TriPure Isolation Reagent® (Sigma-Aldrich, St. Louis, MO, USA)
according to the protocol recommended by the supplier. The quantity and quality of the
RNAs were evaluated by capillary electrophoresis (Bioanalyzer 2100, Agilent, Santa Clara,
CA, USA). Gene expression was measured using a DNA microarray technique. A full
transcriptomic analysis (Affymetrix, Santa Clara, CA, USA) was developed by the external
company Bioalternatives SAS. The “fold change” thresholds (value corresponding to the
ratio: signal intensity value of a probe corresponding to the processed sample divided
by the signal intensity value of a probe corresponding to the control) have been defined
and applied to standardized data to filter more relevant upregulated and downregulated
genes. The percentage of fold change values are represented for selected genes. The studied
genes for antioxidant response were as follows: HMOX1 (heme oxygenase-1), TXNRD1
(thioredoxin reductase) and OSGIN-1 (oxidative stress induced growth inhibitor 1). These
genes were found in fibroblasts treated with 1.1% S rebaudiana extract. Studied genes for
evaluating inflammatory response were PTGS2 (Prostaglandin-endoperoxide synthase 2,
also known as COX-2) in keratinocytes treated with 0.37% S rebaudiana extract.
ORAC METHOD: TEAC ASSAY
The oxygen radical absorbance capacity (ORAC) method evaluates the ability of antioxidants
in a sample to limit the oxidation of fluorescein, a fluorescent probe that is sensitive to
oxidation, by generated peroxyl radicals by a thermolabile oxidizing compound (AAPH).
The oxidation of fluorescein is accompanied by a decrease in fluorescence measured over
time (excitation is 485 nm, emission is 520 nm). The antioxidant compounds involved in
this reaction thus limit, at least for a time, the loss of fluorescence. The sample’s antioxidant
potential is determined by the difference in area under the curve with the area under
the curve of a control without antioxidants. The antioxidant potential is expressed in a
concentration that is equivalent to an antioxidant of reference (Trolox), where 1 ORAC unit
is equivalent to 1 µmol of Trolox per g or per 100 g (extracts and fruits) or 1 µmol of Trolox
per µmol of pure compound.
INHIBITION OF INTERLEUKIN 6 (IL-6) RELEASE IN HUMAN EPIDERMAL KERATINOCYTES
HEKa were seeded in a 96-well black plate (PerkinElmer, Inc., Waltham, MA, USA) in
culture medium. After 24 hours of incubation at 37°C in 5% CO
2 humidified air, the
medium was removed and keratinocytes were treated with the proinflammatory TNF-α
at 0.25 ng/mL, which shows an inflammatory effect with an increase in IL-6 levels this
medium was then used as a positive control. Keratinocytes were also treated with the
combination of TNF-α and either 0.05 µg/mL retinoic acid, 0.005% S rebaudiana extract,
or 0.005% bakuchiol. Cells treated with the medium alone were used as a control. After
48 hours of incubation, all supernatants were collected and kept at -20°C until they were
analyzed by ELISA for interleukin-6 protein (Thermo Fisher Scientific, Waltham, MA,
USA) following the provider’s instructions. These results were normalized with the total
viable cell number for each condition calculated by the PrestoBlueTM staining assay (Thermo
Fisher Scientific, Waltham, MA, USA). The obtained values were normalized compared
to the control and represent the mean of three independent experiments performed in
triplicates. The statistical analysis used was the unpaired student’s t test.