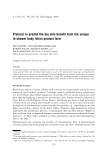
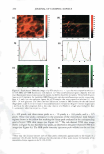
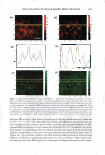
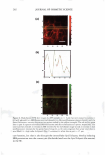
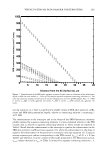
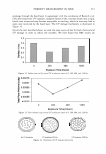
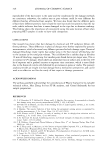
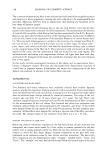
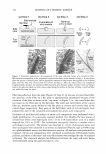
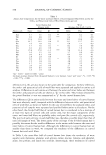
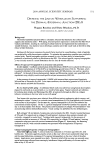
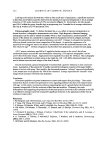
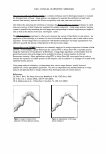
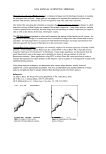
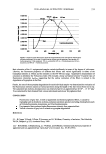
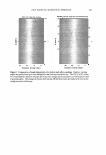
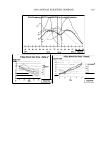
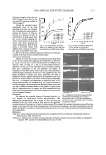
270 JOURNAL OF COSMETIC SCIENCE systems, it is important to be able to minimize the deleterious effects of mechanisms (a) and (6) above on the skin barrier. Clearly, the first step in this direction involves being able to identify if mechanism (a) or (b), or both, induces significant skin barrier perturba tion. The dual-channel TPM skin images obtained following exposure of the skin to surfactant-humectant systems, when analyzed using the image deconstruction analysis described below, can identify the relative roles of mechanisms (a) and (b) in inducing skin barrier perturbation. To elucidate the effect of aqueous contacting solutions i-v on the corneocyte keratins and on the intercellular lipid bilayers of the SC, a two-dimensional slice, 5 pixels (width) [y = 1 to 5} x 256 pixels (length) [x = 1 to 256},6 of the red-channel (SRB) and the green-channel (skin autofluorescence) TPM skin images was selected for analysis of the location of SRB relative to the inherent skin barrier morphology. Note that the arbi trarily .selected line width of 5 pixels accounts for intensity variations along the width of the slice, while limiting the inclusion of intensities that may result from different SC morphological features in the average value (21). The slice of 5 pixels (width) x 256 pixels (length) was deconstructed into its pixel intensity values to determine the inter cellular region width, defined by the fluorescence intensity peak widths. At each posi tion along the length of this slice, the intensities of the corresponding 5 pixels along the width were averaged and then normalized. Because the skin autofluorescence and the SRB fluorescence signals span two different intensity ranges, the fluorescence intensity normalization enables a comparison of the relative changes in the spatial intensity distributions between these two fluorescence intensity signals in the context of the same normalized scale, where values of zero reflect the absence of a fluorescence intensity signal and values of 1 reflect maximum fluorescence intensity signals (21). The green-channel skin autofluorescence intensity spectrum, plotted as a function of the length of the slice (in pixels, 1-256), reveals: (A) the peak-to-peak separation that indicates the width of the corneocytes in the SC and (B) the peak width that indicates the intercellular spacing that is essentially comprised of the intercellular lipid bilayers and the corneocyte envelopes (20-23). The corresponding plot of the SRB fluorescence intensity spectrum for the red channel describes the SRB distribution relative to the inherent skin morphology, as defined by the green-channel skin autofluorescence inten sity spectrum. The peak widths and peak heights in the normalized average SRB intensity profiles in p-FTS samples exposed to aqueous contacting solutions i, ii, iii, and v were compared to the peak width and peak height of SRB in the p-FTS sample exposed to the aqueous PBS control contacting solution (iv). Through this comparison, it was possible to determine an enhancement, or a reduction, in the SRB penetration into the corneocytes induced by solutions i, ii, iii, and v relative to the PBS control solution (iv). Specifically, an increase in the peak height and a decrease in the peak width indicate less SRB penetration into the corneocytes relative to the intercellular lipid bilayers. This serves as a qualitative indicator of mechanism (b) above, that is, intercellular lipid bilayer disruption, because a disordering of the lipid bilayers induced by the surfactant humectant system should result in an increase in the defects or voids in the bilayers, which in turn, should increase the size/number of aqueous pores (2,31-34,45) through 6 Note that in the TPM skin images, 256 pixels corresponds to 100 µm in dimension therefore, a 100-µm x 100-µm image is actually a collection of 256 x 256 = 65536 pixels.

VISUALIZATION OF SKIN BARRIER PERTURBATION 271 which SRB may penetrate into the lipid bilayers of the SC. Conversely, as the peak height decreases and the peak width increases, there is more SRB present inside the corneocytes relative to the intercellular lipid bilayers. This serves as a qualitative indi cator of mechanism (a), that is, keratin denaturation in the corneocytes, because a disruption of the corneocyte envelope and subsequent keratin denaturation induced by the surfactant-humectant system should result in an increase in SRB penetration into the corneocytes in the SC. THEORETICAL DETERMINATION OF ENHANCEMENTS IN AQUEOUS PORE CHARACTERISTICS INDUCED BY SURFACTANT-HUMECTANT SYSTEMS USING THE SRB INTENSITY PROFILES IN THE SC The four intrinsic membrane characteristics of the skin barrier are: (a) the porosity, B, which is the fraction of the skin area occupied by the aqueous pores, (b) the tortuosity, 'T, which is the ratio of the permeant diffusion path length within the skin barrier to the skin barrier thickness, (c) the average pore radius, rpore' 7 and (d) the skin barrier thick ness, LlX (2,34-38,40). The goal of the analysis presented here is to obtain quantitative values of the aqueous pore radius, rpore' and of the enhancement in the porosity-to tortuosity ratio, BIT, induced by aqueous contacting solutions i, ii, iii, and v-denoted hereafter as the chemical enhancer (E), relative to the aqueous PBS contacting solution iv-denoted hereafter as the control (C). In addition to the visual insights that can be obtained from the TPM skin visualization studies, the analysis presented below can provide quantitative insight on the modification of the skin barrier induced by E relative to C. For example, two modes of perturbation to the aqueous pores are possible: (1) a modification in the average pore radius, rpore' and (2) a modification in the porosity-to tortuosity ratio, BIT (2,34-38). The perturbation to the aqueous pores, due to mode 1, is of particular interest for the skin penetration of large irritants present in a skin cleansing formulation, such as surfactant micelles, because a critical average pore radius, rcrit' 8 is required to allow skin penetration of these large permeants (2,3,34). Clearly, as long as rirritant rcrit! where rirritant is the radius of the irritant, then even if (e/T)E(e!T)c, that is, if the enhancement in the porosity-to-tortuosity ratio is greater than unity [E(e!T) 1}, no skin penetration enhancement of the irritant will take place. Conse quently, such a formulation should be mild to the skin because the irritant, which could have induced skin barrier perturbation, will not be able to penetrate into the skin. In the Results and Discussion section, we will implement our theoretical framework to quan titatively evaluate the aforementioned two modes of perturbation to the aqueous pores induced by E relative to C. Based on the four characteristics of the skin barrier (a-d) (see above), one can express the permeability, Pi, of permeant i (where i corresponds to SRB in the TPM skin visual- 7 Note that rpore is, in fact, an average aqueous pore radius (see Table I) (2,34,35,38,45). In the case of a size distribution of aqueous pore radii, rpore can be considered to be the expectation value of this distribution (2,38). 8 It is noteworthy that the critical average pore radius, rcritJ is a function of the size distribution of aqueous pores in the SC (2,38).
Purchased for the exclusive use of nofirst nolast (unknown)
From: SCC Media Library & Resource Center (library.scconline.org)