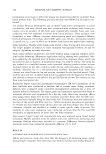
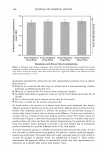
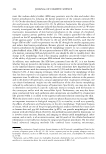
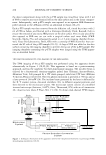
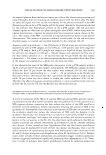
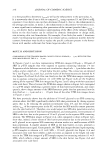
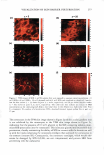
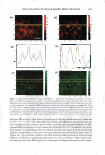
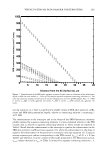
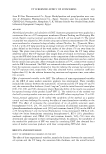
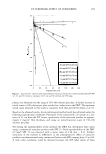
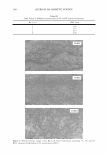
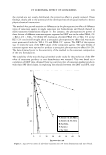
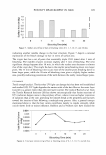
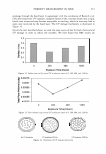
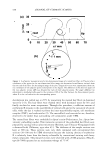
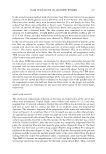
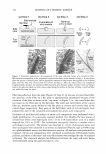
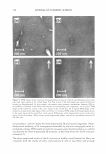
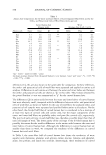
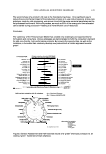
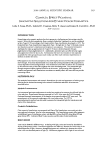
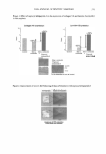
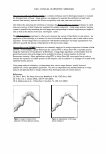
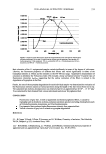
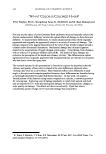
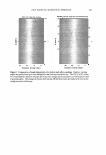
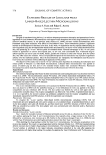
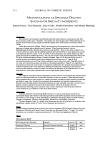
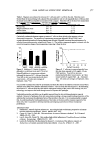
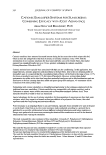
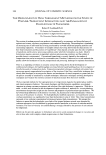
276 JOURNAL OF COSMETIC SCIENCE it is then possible to determine rpore E as well as the enhancement in the pore radius, Er It is noteworthy that if one is able 'to compute Er using equation 19, and E(s/'r) usi�g pore equation 13 (see above), one can then determine if mode 1, that is, the enhancement in the average pore radius, or mode 2, the enhancement in the porosity-to-tortuosity ratio, is more significant in enhancing skin penetration of the irritant (provided that r i rr itant rcr i t! see above). Such a mechanistic understanding of the effect of the enhancer formu lation on the skin barrier can be utilized by cosmetic formulators to design mild, non-irritating skin care formulations. For example, if one finds that mode 1 dominates mode 2 in enhancing skin penetration of an irritant such as a surfactant micelle, then the cosmetic formulator may decide to replace the specific surfactant present in the formu lation with another surfactant that forms larger micelles (2-4). RES UL TS AND DISCUSSION COMPARISON OF THE TPM SKIN IMAGES CLOSE TO THE SC SURFACE (z = 3 µm) WITH THE TPM SKIN IMAGES BELOW THE SC (z = 20 µm) In Figures 2 and 3, we show representative TPM skin images (100-µm x 100-µm) of SRB in p-FTS samples that were exposed to aqueous contacting solutions i-v (see Preparation of the Solutions section) and visualized at a depth of z = 3 µm below the skin surface, and at a depth of z = 20 µm below the skin surface. The corneocytes are denoted by C (see Figures 2a,c,e and 3a,c), and the nuclei of the keratinocytes are denoted by N (see Figures 2b,d,f and 3b,d). One can clearly see that the TPM skin images correspond ing to aqueous contacting solution i (1 wt% SDS) (see Figure 2a,b) are the brightest among all the reported TPM skin images (see Figures 2 and 3 along with their associated color scale bars). This is because the TPM skin images shown in Figure 2a,b correspond to a p-FTS sample exhibiting a greater extent of skin barrier perturbation, and conse quently, show a larger amount of the SRB fluorescent probe that has penetrated into the skin (both at z = 3 µm and at z = 20 µm) than all the other TPM skin images shown in Figures 2 and 3. We have previously shown that the addition of 10 wt% glycerol to an SDS contacting solution above the CMC significantly inhibits SDS skin penetration by closing aqueous pores, that is, by reducing the porosity-to-tortuosity ratio, e/'T, and the average pore radius, rpore! of the aqueous pores in the SC, such that the SDS micelles cannot penetrate into the skin barrier (2). Therefore, one would expect less SDS skin penetration and an associated lesser extent of skin barrier perturbation, and consequently, lower amounts of SRB in the skin, due to the presence of 10 wt% glycerol in the aqueous SDS contacting solution. The TPM skin images in Figure 2c,d, when compared to those in Figure 2a,b, show that, indeed, a lesser extent of skin barrier perturbation due to the presence of 10 wt% glycerol in an aqueous SDS contacting solution results in a smaller extent of SRB skin penetration. A smaller amount of SRB in the skin barrier, in turn, generates a weaker fluorescence signal. Consequently, the TPM skin images obtained upon exposing p-FTS samples to solution ii (1 wt% SDS + 10 wt% glycerol) (see Figure 2c,d and associated color scale bars) exhibit a dark red color, as opposed to the bright red color seen in the TPM skin images of p-FTS samples exposed to contacting solution i ( 1 wt% SDS), which reflects a larger amount of SRB in the skin barrier (see Figure 2a,b and associated color scale bars).

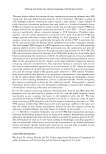
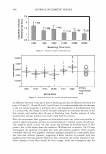
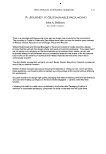
VISUALIZATION OF SKIN BARRIER PERTURBATIO 277 (a) z = 3 (b) z = 20 (c) (d) sa 100 ,sa 20) 2'° (e) ,(f) � 111 1111) ?ti! r.,o Figure 2. TPM images of SR, , in p•FT samples that were expc,. eel to aqueous contacting oiutions i (1 wt% D ), ii (1 wt% + 10 ,.,t% glycerol.,, n I iii (1 wt I, imd visu Ii a d J l o: 3 µm. bt low the skin �urfu.ce fa = 3), shown in parts a, c, and e, r speccively, and O 1,1m below the "kin surface (z = 20), ·howu in parts b, d, , nd f, respectively. The color scale bars indicatll an, increase.: in RB c nc nt , tion as he col r pr- gr es from a lo , lue cl · e ro zer, (bln k) r a hi h al e (r l). Ke,,: C-corneocyte N-nucle1,.1s of a keratinocyte LTR-localized transport region yellow hne in part a- 25 p.m. The comeocytes in the Tl'M skin ima,ge shown in Figur 2a ,exhibjr a color gradj nr that i , n.ot exhibited by the c rn ocyte i.n the TPM ki.n image · hown in igure 2 , indjca,cin that the presence of 10 wt% glyc ro] in the D .. contacting o. ution mini miz s RB penerra ion inrn the corn oc c s. This is because gl c ml minimiz s DS skin penemuion, thereby minimizing the abilir. of SD co inre.ra.c- ich rh kera in as v eH as irh th" hp.i.d compdidn, th corn oc t □ lop s that urround he comeocy in the smunm com um (SC). Cons, ,,ucm ly, th com ocyte en lo es. �. hi h ould o h-- b dama , cl b · DS (-,9,26), not comJJro 1is cl, an - pr� enr · RB from p n rat·o
Purchased for the exclusive use of nofirst nolast (unknown)
From: SCC Media Library & Resource Center (library.scconline.org)