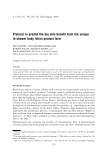
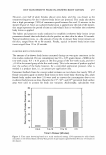
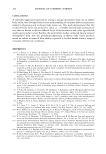
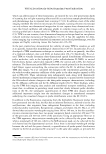
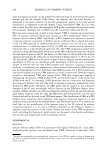
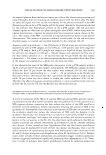
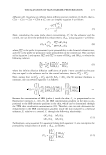
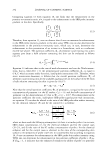
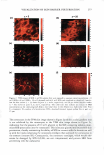
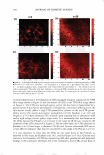
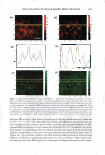
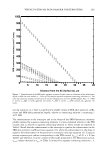
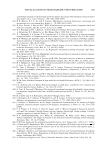
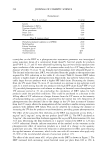
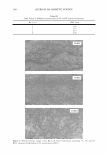
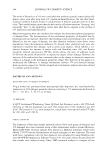
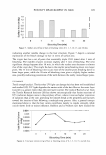
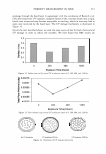
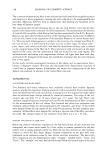
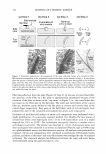
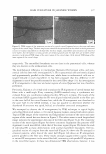
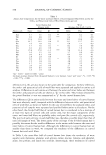
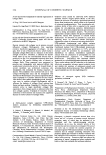
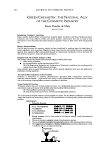
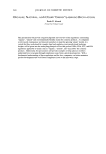
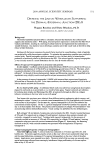
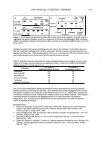
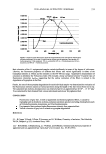
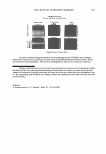
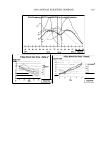
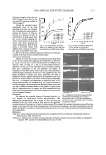
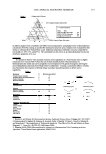
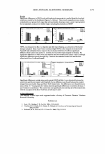
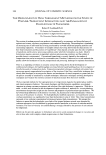
27 JOURNAL OF COSMETIC SCIENCE z=3 (a) 50 1QQ i-50 200 ?!ill (c) 50 ·1oqi, ,� liQ'J z=20 (b) 60 � 11l!:l ··� 2Q 2W ·,a � (d) 140 50 120 100 10c;I 80 150 (ill -'!Ill 200 20 2$0 i!;O sample· that wen: cxposcxl to aquL"ou~ con · iuil · iv (PBS :od visua.liz d at a d pth of: 3 prn h kin surface (z = 3), , . ely, and 20 µm below Lh s.kiri surface (z = 20), shm n in parts b and d, r . . color scale bm· indic, te tlll inw:, · · in RB o, cermation , th color _progre� e fr m a lo, lu: · ro b!a. k) to a hi h ,mlue (reJ). Key: -nm o,cyte · -nucleus of a keira- tinocyce yellow ... a - 25 µm. A related observation is the form tion of L TR· (loc---.,iJized transport r gions) in the TPM kin ima e ·hown in I igure 2a and t e ab ience c f L TR. in the TPM in image sho. n in Figure 2c. The LTRs are localized r gions within the skin b.rrier ch m.cterized by a greater extent of skin barrier percurb:u:ion. Consequent! , a permeant di· in across the skin barrier would xhibit a hi h LTR erm .. bilir r lative to the n n- TR erme abiht and to the overa]] sbn barrier l erm ability ( 1,42). Ku hner et al. (41) and Pliquet et rt!. ( 2) have o sen d TR. in the Cup n in• skin t Jrrasound+SD , and to hi· h-v Ir •e electric p 11 , r-s crivel . It is note _orrhy th t the di�meters of the LTR report: cl by Pliquet et al. ( 2) a e in the r, nge of 0- 0 µm, similar to the di· meter of the LT Rs obs.er ed in Fi. ure 2a. On the tl er h .n , tl e L R obs ed by Ku hner et al. ( 1) are lar er in di, meter ( 1 mm), becau e u]tr. ound + DS acts am re e ective enh, cer than the ones con i ered i11 this study or by Pliqu t et al. (42). It is also important to stress that the LTRs are not sweat ducts or hair follicles, as oh �rved in this stud , by Ku hneret al. ( J), nd by PliqlleL t al. ( 2). Gl cerol m.,y m · nimize the formation of L TRs by minimizin SDS kjn enetr tion ·nd associat cl dama re to the comeocyte en velor es and to the com ocyt . Such LTR. do not form in

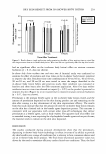
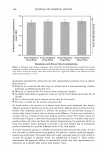
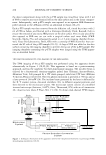
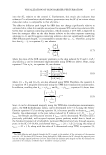
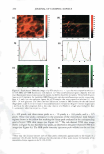
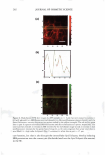
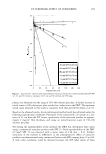
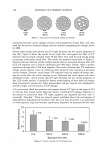
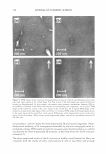
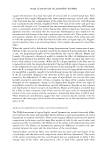
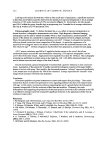
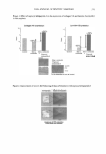
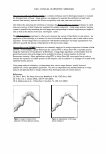
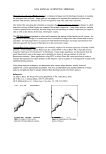
VISUALIZATION OF SKIN BARRIER PERTURBATION 279 the skin barrier exposed to aqueous contacting solution iii (1 wt% SCI), as shown in Figure 2e,f. This is because SOS, being a harsher skin agent than SCI (6,45), interacts strongly with the skin barrier. Because of the inherent heterogeneity of the skin barrier, the SOS-skin barrier interaction is heterogeneous in nature. One of the manifestations of this heterogeneous interaction is the formation of heterogeneous L TRs in the skin barrier. The milder surfactant, SCI, exhibits a weaker skin barrier interaction relative to SOS, particularly with the corneocyte envelopes and the corneocyte keratins (6,45). Therefore, SCI does not induce the formation of LTRs in the skin barrier. At z = 20 µm, the TPM skin image of the p-FTS sample exposed to solution i shows more SRB relative to the TPM skin images of the p-FTS samples exposed to solutions ii-v (see Figure 26 with its associated color scale bar and compare it to Figure 2d,f and to Figure 3b,d, with their associated color scale bars). Therefore, not only does SOS (1 wt%) induce a greater extent of skin barrier perturbation, but in addition, this pertur bation extends deeper into the skin barrier relative to the skin barrier perturbation induced by aqueous contacting solutions ii-v. ANALYSIS OF THE DUAL-CHANNEL TPM SKIN IMAGES CLOSE TO THE SC SURFACE (z = 3 µm) The dual-channel TPM skin images of p-FTS samples exposed to aqueous contacting solutions i-v, at z = 3 µm, are shown in Figures 4, 5, and 6. In all these figures: (a) the SRB probe fluorescence (red-channel) images are shown in the top panels (Figures 4a,d, 5a,d, and 6a) (b) the skin autofluorescence (green-channel) images are shown in the bottom panels (Figures 4c,f, 5c,f, and 6c) and (c) the overlay of the normalized SRB probe fluorescence (the red line) and the skin autofluorescence (the green line) spectra are shown in the middle panels (Figures 46,e, 5b,e, and 66). Yu et al. have shown that the skin autofluorescence spatial intensity distribution is independent of the specific SRB skin penetration pathways (21). As a result, the SRB skin spatial distributions can be characterized relative to the green-channel skin auto fluorescence maps of the intrinsic skin morphology (21). In the green-channel TPM skin images in Figures 4, 5, and 6, the corneocytes correspond to the dark polyhedral regions surrounded by the green autofluorescence of the SC intercellular lipid bilayers. The SRB skin spatial distributions shown in these figures provide evidence that aqueous contact ing solutions ii-v primarily interact with the intercellular lipid bilayers of the SC and induce SRB to be localized within the bilayer domains of the SC. On the other hand, aqueous contacting solution i, containing 1 wt% SOS, interacts strongly with the lipid bilayers as well as with the corneocytes of the SC, thereby inducing SRB penetration into the corneocytes as well as into the lipid bilayers of the SC (compare Figures 4a and 4c). A quantification of the observations made above about the dual-channel TPM skin images is presented below. For this purpose, a linear image deconstruction analysis was used (see the discussion of dual-channel image deconstruction analysis, above). The normal ized red- and green-channel fluorescence intensities within a linear deconstruction path of a 256 x 5 pixel skin area (see the yellow rectangles in the top and bottom panels in Figures 4, 5, and 6) were examined to quantify the SC morphological modifications induced by aqueous contacting solutions i-v. As mentioned above, these plots are shown in the middle panels in Figures 4, 5, and 6. In Figure 46, the autofluorescence spectrum (green line) of the p-FTS sample exposed to solution i (1 wt% SOS) exhibits one major peak at
Purchased for the exclusive use of nofirst nolast (unknown)
From: SCC Media Library & Resource Center (library.scconline.org)