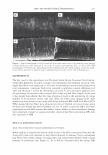
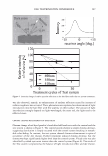
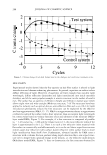
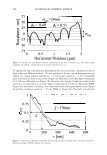
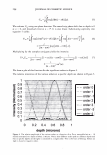
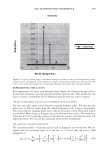
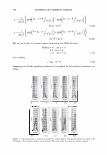
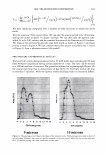
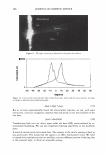
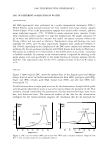
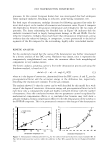
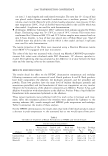
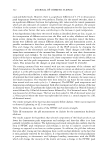
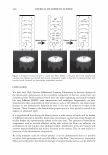
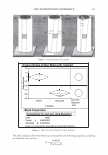
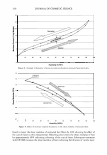
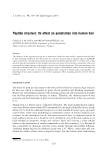
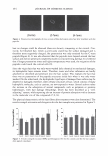
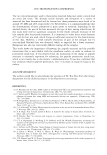
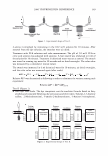
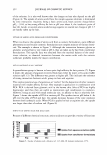
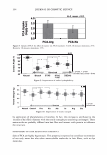
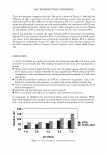
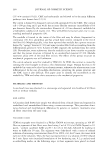
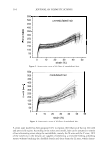
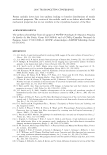
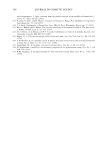
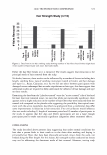
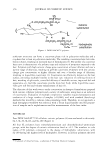
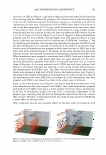
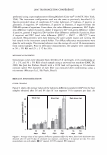
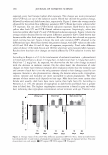
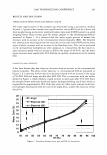
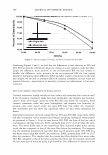
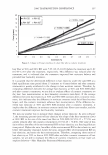
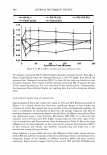
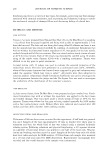
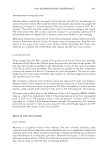
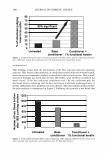
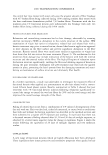
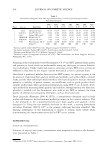
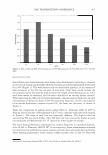
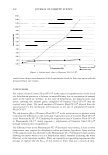
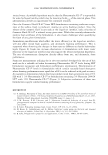
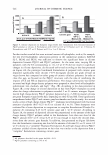
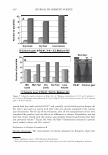
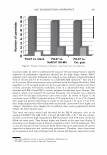
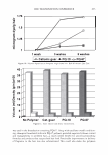
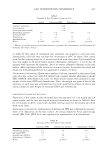
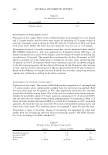
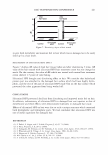
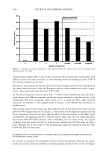
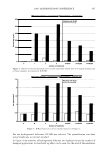
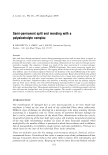
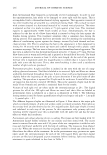
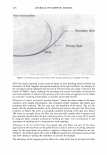
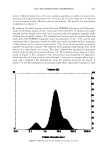
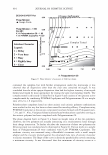
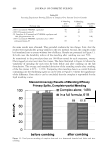
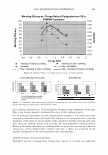
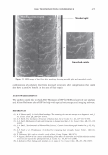
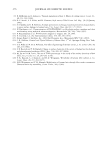
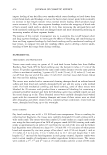
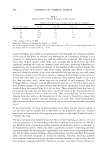
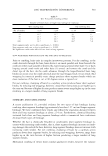
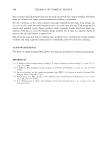
2006 TRI/PRINCETON CONFERENCE 1.40 ------------------------ --- ---- 1.20 -i---- - - - - 1 00 � 0.80 � 0.60 a: 0.40 020 0.00 0% 5% 10% 15% 20% HFCS 417 30% Figure 2. Effect of Farmal HFS 2656 on foam rate of 10% Phoenomulse CE- 1 /5% SLES (20-25°C, 50-60% RH). QUANTIFYING FOAM Initial Foam rate determinations were made using formulations containing a constant active level of sodium lauryl sulfate (SLS) and varying saccharide hydrosalate§ levels from 0 to 30% (Figure 2). This work focuses only on initial foam quantity, or the amount of foam produced in the first few minutes of activation. Total foam would include the initial quantity plus the quantity produced over the length of time foaming occurs. Since total foam cannot be measured, this has been identified as an area for further research. When observing the effects of saccharide hydrosalate concentration on foam rate, an ideal concentration is defined at about 6-8% for maximum foam rate. As the concentration of saccharide hydrosalate increases beyond 8%, the foam rate decreases, as shown in Figure 1. Foam rate comparison of sodium lauryl sulfate (SLS) vs. Planteran 2000 N UP® at Varying Concentrations of Phoenomulse CE-1 ® and a constant surfactant level resulted in Figure 3. The slope of each line was drastically different. The slope of the line representing SLS was much higher. Also, SLS foam rate was consistently higher at equal concentrations of Phoenomulse CE-1 ® , about five times higher on average. The lower foam performance, represented by a slower foam rate in equivalent formula- tions of SLS vs. Planteran 2000 N IP® is not surprising. Foam measurements acquired by traditional test methods for passive systems conclude decyl glucosides have somewhat lower foaming performance verses anionic sulfate systems such as SLS (5 ). Perceived § Saccharide hydrosalate (Farmal HFS 2656®, Corn Products, Bedford Park IL, 60501).

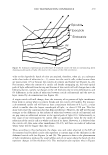
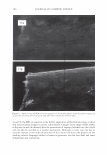
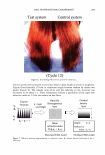
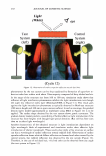
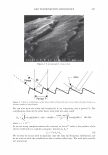
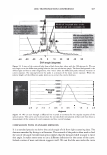
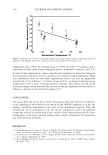
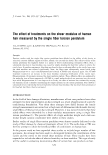
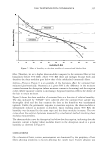
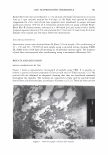
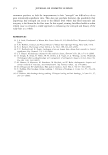
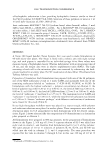
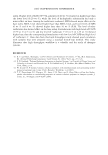
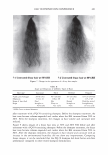
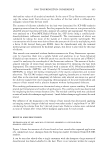
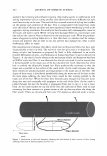
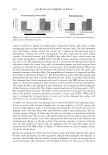
418 JOURNAL OF COSMETIC SCIENCE 13.00 12.00 11.00 +------------- 10.00 +--------- - 9.00 � 8.00 c -m 7.00 8 6.00 +------- Q) a:: 5.00 4.00 ·+------ 5 10 15 % Phoenomulse CE-1 / Figure 3. Sodium lauryl sulfate vs Planteran 2000 N UP®. 20 25 ........ Sodium Lauryl Sulfate -Planteran 2000 results from subjective evaluations of the formulations tested for foam rate agree with the measured foam rate results. CONCLUSIONS The release of some Cosmetic Fluid CF-61 ® at the surface is hypothesized to be the result of a dehydration process or a decrease in water efficiency due to evaporation of external water at the liquid-air interface. In this state of dehydration, the nanostructures may invert, releasing the internal phase, comprised of Cosmetic Fluid CF-61 ® into the external water phase. The small amounts of Cosmetic Fluid CF-61 ® released from the nanostructure by this mechanism will evaporate at the rate of unstabalized Cosmetic Fluid CF-61 ®. The stabilization effect of Cosmetic Fluid CF-61 ® in the nanostructure is apparent when comparing the differences in the individual evaporation rates of Cosmetic Fluid CF-61 ® verses Phoenomulse CE-1 ®. Comparing the evaporation rates of Cosmetic Fluid CF-61 ® to Phoenomulse CE-1 ® clearly supports a stabilization of Cosmetic Fluid CF-61 ® through nanostructure encapsulation. The differences seen in the Phoenomulse CE-1 ®!deionized water system, at least at room temperature, may support the dehydration release mechanism hypothesis. Some settling of the nanostructures was observed in the Phoenomusle CE-1 ®/deinonized water system, allowing the excess water to act as a dehydration shield, therefore increasing the water efficiency at the liquid-air interface. There are currently no supporting experiments that attempt to explain why the Kevap of this system is lower than just a system of dein-
Purchased for the exclusive use of nofirst nolast (unknown)
From: SCC Media Library & Resource Center (library.scconline.org)