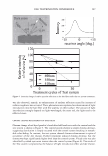
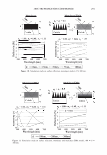
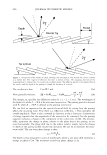
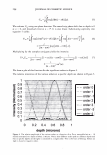
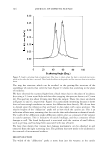
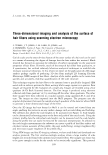
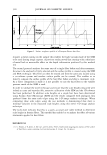
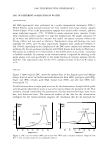
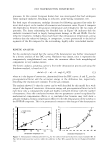
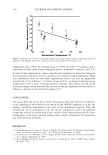
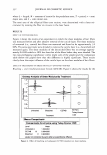
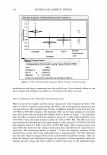
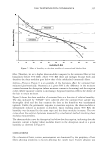
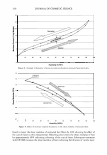
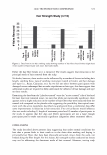
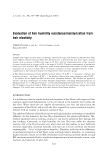
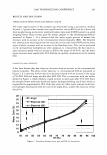
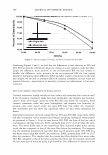
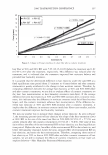
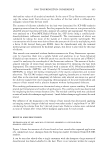
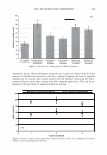
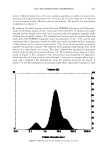
308 JOURNAL OF COSMETIC SCIENCE and find the location that divides the area into two equal parts. This procedure works well on the simulated data, arriving at tilt angles that are within about 0.2 degrees of the input values. The error in the estimator is not statistical, but biased. It does not work for small tilt angles where almost all the energy is in the zeroth order (the intensity weighting of the orders is not linear function of depth). The errors in the estimate are comparable to those that are experimentally quoted. SUMMARY The shape of the "specular" peak that one finds in light scattering experiments on hair can be explained by diffraction from the cuticle structure. The shape depends both upon the periodicity of the cuticles and their thickness. The experimental techniques that extract cuticle tilt angles assume that the positions of the scattering peaks can be determined by geometric optics. This is not supported by the analysis given here. The assumption leads to systematic errors. These experimentally quoted errors associated with these measurements are not statistical but systematic. REFERENCES (1) M. V. Klein, Optics Qohn Wiley & Sons, New York, 1970), pp. 338-349. (2) W. R. Roach, C. B. Carroll, A. R. Firester, I. Gorog, and W. Wagner, Diffraction spectrometry for videodisk quality control, RCA Review, 39(3) 272 (1978). (3) J. W. Goodman, Introduction to Fourier Optics (McGraw-Hill, New York, 1968). (4) J. T. Moon and S. R. Marschner, Scattering in hair using a photon mapping approach, Tranaction on Graphics, 25, 3 (Proceedings of SIGGRAPH 2006).

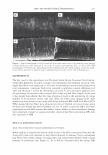
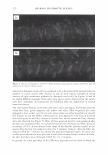
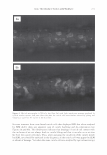
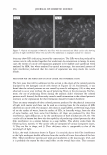
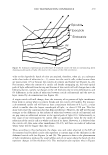
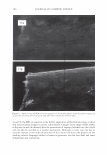
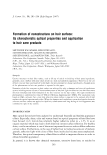
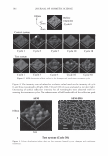
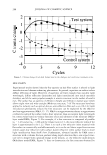
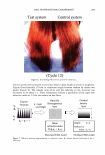
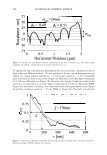
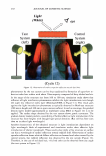
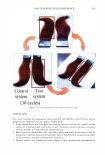
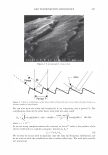
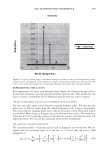
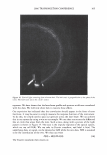
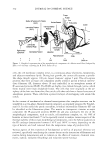
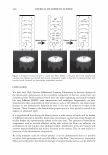
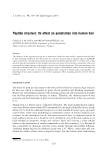
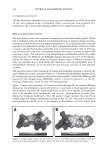
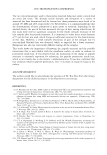
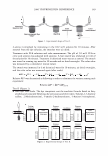
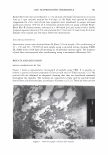
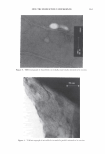
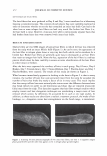
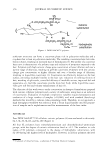
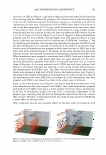
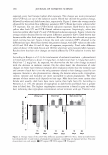
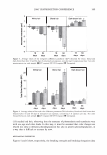
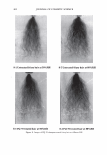
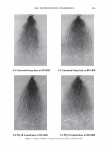
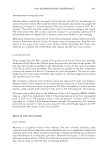
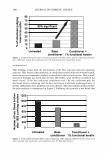
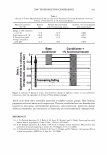
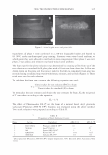
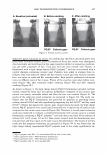
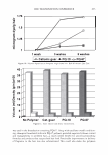
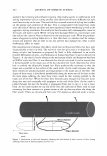
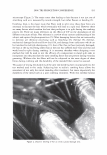
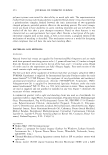
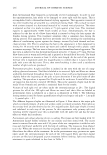
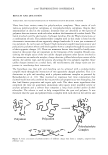
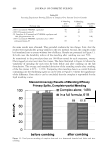
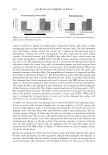
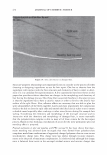
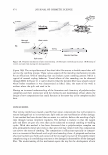
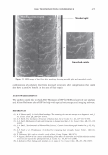
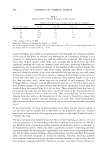
]. Cosmet. Sci.! 58, 309-310 Quly/August 2007) Three-dimensional imaging and analysis of the surface of hair fibers using scanning electron microscopy C. TOMES, J. T. JONES, C. M. CARR, D. JONES, and J. CRIMMINS, Textiles & Paper, The University of Manchester! Manchester M60 1 QD (C. T.,]. T J., C.M.C.), and Croda Chemicals Europe, Cowick Hall, Goole DN14 9AA (D.J.,J.C.), U.K. Cuticle scales are the most obvious feature of the outer surface of a hair and can be used as a means of assessing the degree of damage that the hair surface has received. Much research has focused on assessing the influence of surface topography on the associated properties of hair fibers. However, much of the research has either been qualitative, or if quantitative, has utilised relatively laborious analytical techniques to establish the necessary statistical robustness. In this review we report on the application of a 3D image analysis package capable of producing 3D data from multiple 2D Scanning Electron Microscope (SEM) images of hair fibers. Analysis of the surface profile can be carried out quickly and accurately, enabling quantification of the scale structure. This technique requires the hair fibers to be mounted onto a specifically designed SEM metal stub in order to prevent the fibers moving while image capture is in process. Four images are required for the evaluation of a single area. Images are recorded using a four quadrant (A-D) Back Scattered detector. The first image is produced using electrons collected only from quadrant 'A', by switching off the other three quadrants. The other three images were then collected in a similar manner, using quadrants B, C and D in turn. The images are then imported into the MeX program. The program uses the angular displacement between the sample and each quadrant of the detector allows MeX to generate a three-dimensional image of the fiber. Once the 3D image has been formed in MeX it can be rotated and viewed from any angle, enabling the viewer to see any surface damage such as scale lifting and buckling. The software also allows the scale heights to be measured (see Figure 1). Scale heights can be determined by locating points at the base and peak of the cuticle scale. Using the primary profile data the individual scale heights can be measured and the scale heights along the profile line can easily be extracted for statistical interpretation. In addition to the scale height measurements the software can create a profile of the fiber surface and calculate various measures of this profile, the most useful being average roughness (Ra) and root mean square roughness of the profile (R 9 ). Using SEM images and the 3D imaging software, we have established and developed two analysis protocols. The first involves multiple analyses where a large number of scale heights are recorded from both untreated and treated fibres. The sample size choice has to be great enough in order for the results to be statistically significant. This protocol 309
Purchased for the exclusive use of nofirst nolast (unknown)
From: SCC Media Library & Resource Center (library.scconline.org)