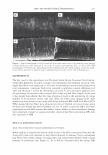
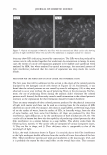
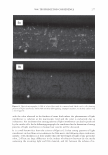
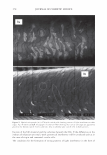
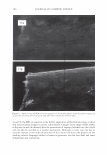
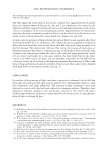
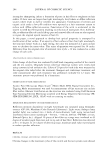
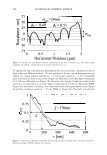
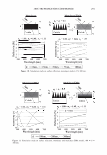
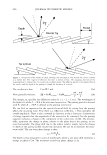
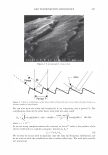
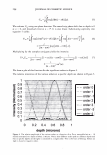
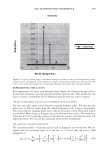
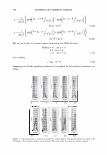
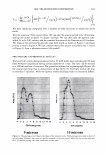
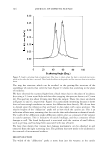
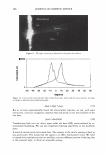
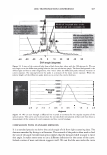
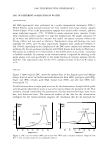
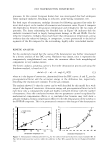
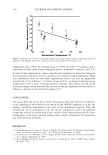
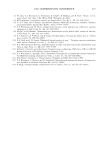
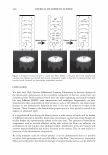
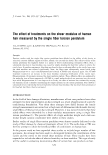
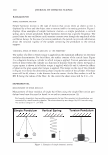
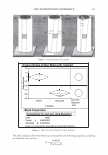
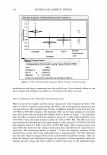
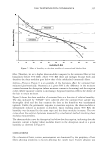
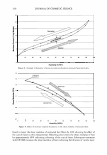
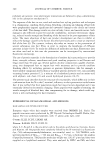
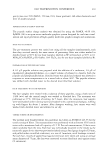
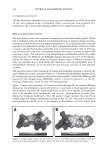
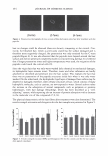
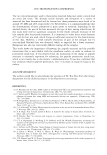
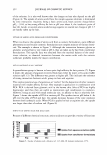
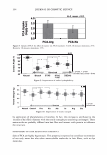
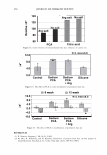
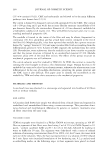
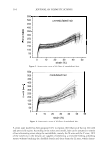
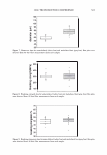
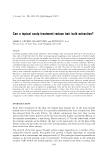
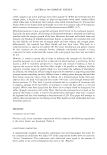
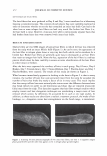
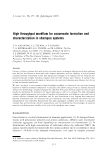
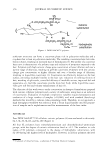
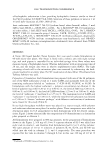
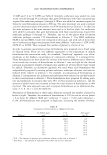
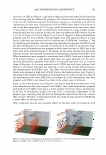
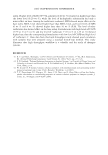
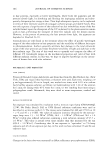
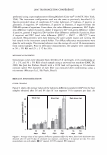
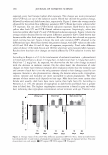
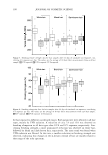
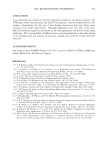
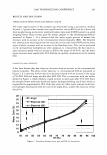
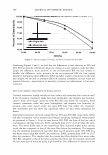
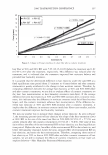
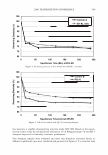
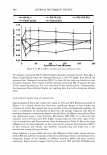
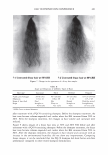
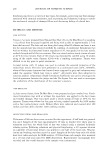
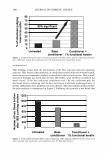
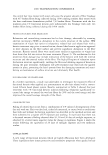
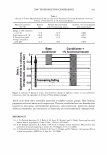
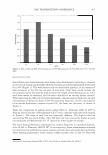
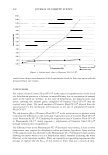
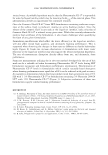
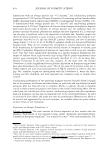
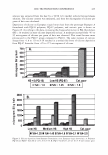
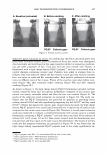
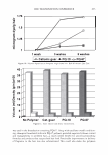
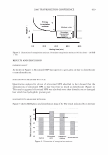
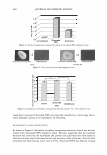
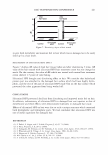
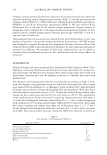
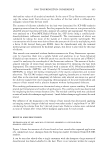
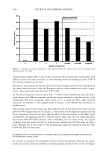
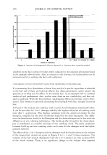
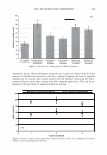
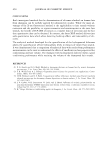
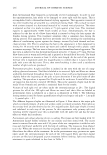
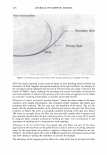
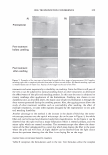
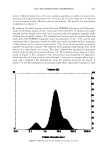
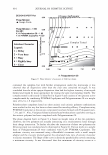
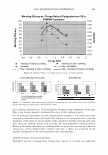
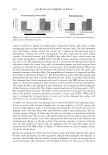
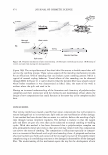
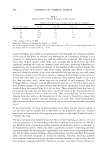
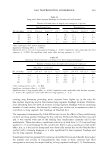
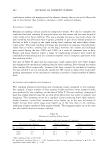
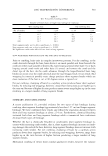
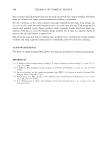
290 75 j 50 rn 25 rn ..§ 0 � -25 0 � -50 -75 0 JOURNAL OF COSMETIC SCIENCE o;. ms =24nm /J0 = 0.49 0.5 1 1.5 2 Horizontal Distance [µm] Figure 8. Vertical size and volume fraction estimations of the fine structure (o-rms: root mean square roughness, p0 and p 1 : volume fraction of air and substrate in o-rms). To explain the light introduction phenomenon for the test system, simulation study on light reflection (Matrix method, 14) was conducted. In the case of homogeneous top surface of a typical organic material (n 1 = 1.45) on hair cuticle (n2 = 1. 5 5 ), remarkable light introduction doesn't occur even though the thickness is less than light wavelength (d 100 nm, Monolayer in Figure 10). However, the change of refractive index to the order of 1.2 is expected to occur more light introduction (d 100 nm, Monolayer/EMA, Figure 10). Satisfiable consistency was obtained between the experimental result (Figure 4) and the simulation result (d = 50 nm, EMA in Figure 10). The light introduction 1 0.75 =170nm 0.25 200 400 600 800 r [nm] Figure 9. Lateral size estimation of the fine structure (� correlation length, C(r): correlation function, r: horizontal distance between random two points).

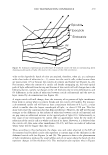
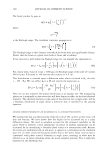
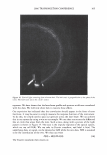
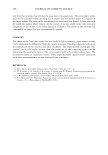
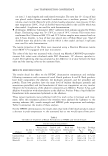
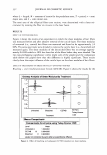
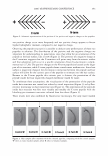
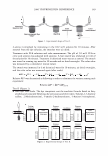
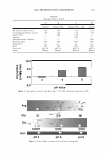
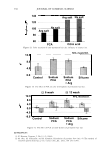
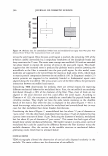
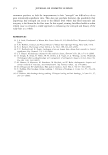
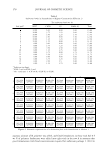
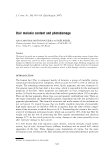
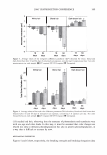
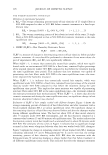
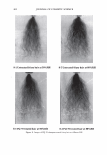
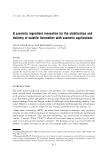
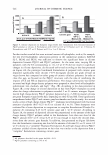
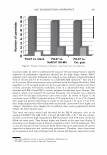
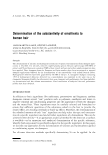
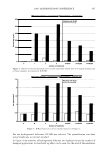
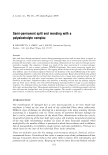
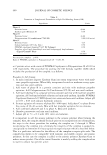
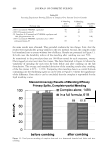
2006 TRI/PRINCETON CONFERENCE Monolayer � qi' n 0 = 1.00, n 1 = 1.45, n2 = 1.55 ,......., 5 � ------ E..... 4 --·-· 0 ·····....... -· --- :� 3 - w:: . ...., .. ,,,----· --=---.-.-.......--- ---------- - --- --------- Q.) c;::::: (IJ 0 380 480 580 680 780 Wavelength [nm] Mono layer/EMA /Jo = /J1 = 0.5 ------------------- -: n l ---- �qi' /J, d l ' ----� Cuticle 380 480 580 680 780 Wavelength [nm] Id· -Onm --25nm, -·-50nm' ---·75nm, ........... JOOnm I . ' Figure 10. Simulation study on surface reflection, monolayer model, d :'5 100 nm. Mono layer/EMA Multilayer/EMA �qi' � qi' 291 n ' 1 n ' 1 ----- -- -------: d-1�==;.�==��=� i' ' ---- n 0 = 1.00, n/ = 1.23, n 2 = 1.55 5�------- � Cuticle n 0 = 1.00--H 1 = 1.45, n 2 = 1.55 5 -- - -- - --- .... d=0nm � 4 f--- - - - ------, .£ 3 .::: � 2 t+:::: �1 -.:..-.-a.--...e.-:--::..-=-•-.c..:-· =-.-.-.-.-.-·-. o��������� 480 580 680 780 380 480 580 680 780 Wavelength [nm] Wavelength [nm] I d: - lOOnm, - - -200nm, -· - 300nm I Figure 11. Simulation study on surface reflection, monolayer and multilayer EMA model, 100 :'5 d :'5 300 nm.
Purchased for the exclusive use of nofirst nolast (unknown)
From: SCC Media Library & Resource Center (library.scconline.org)