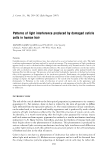
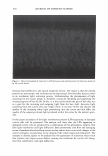
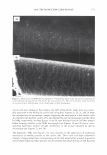
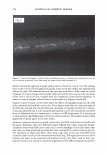
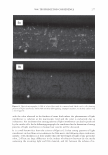
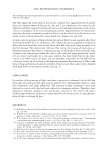
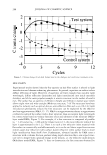
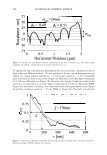
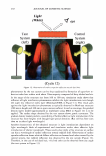
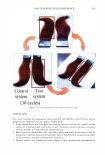
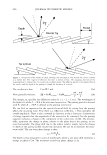
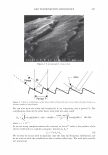
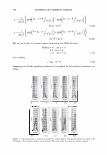
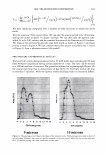
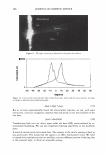
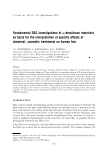
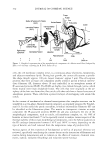
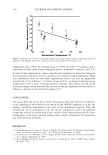
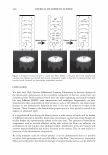
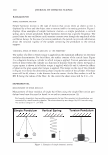
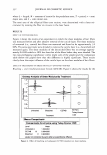
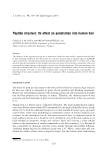
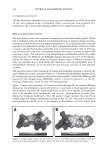
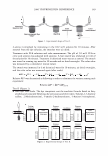
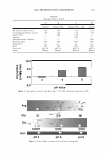
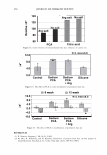
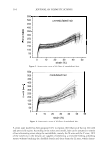
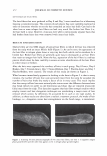
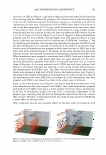
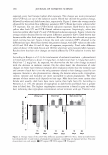
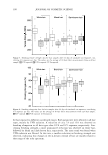
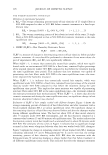
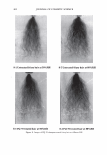
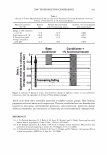
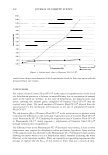
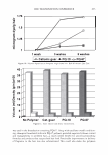
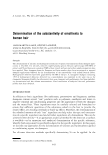
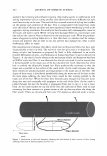
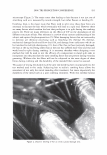
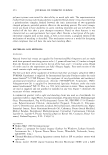
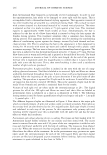
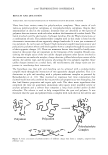
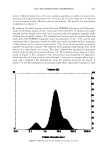
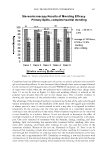
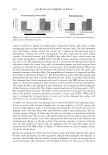
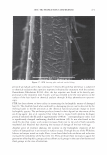
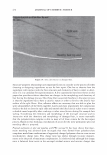
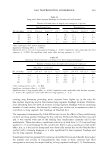
306 - :::i � b · C C JOURNAL OF COSMETIC SCIENCE Figure 11. The light scattering as observed in the plane of incidence. -50 -40 -30 -20 -10 0 10 20 30 40 50 60 degrees Figure 12. A trace of the scattered light from a black Asian hair, taken with the coarse aperture. Its shape is similar to what has been found historically. d(w) = h(w) * g(w) (17) But as we have experimentally found the instrumental response, we can, with some restrictions, construct a frequency response h(w) and divide it into the transform of the raw data. g(w) = d(w)lh(w) (18) Transforming back into our object space yields the data, G(8), unencumbered by in- strumental broadening. We can also implement filtering algorithms in the transform space. A word of caution needs to be made here. The variance in the cuticle spacing is fixed at any given point. This means that the signal is, in effect, fixed pattern noise. We need to sample over multiple positions on the fiber, or across different position of the ring that is the scattered light, to obtain an ensemble average.

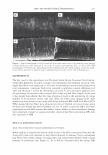
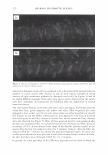
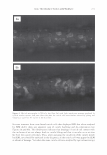
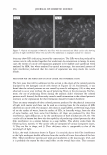
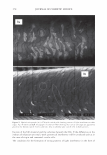
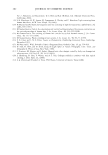
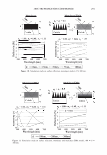
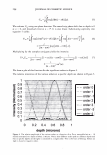
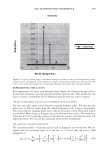
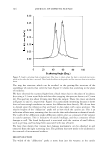
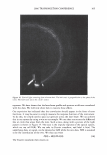
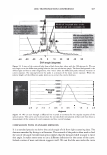
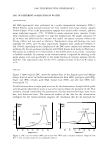
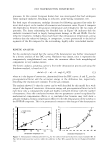
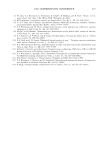
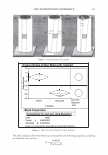
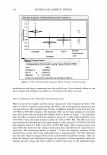
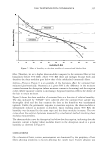
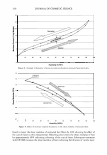
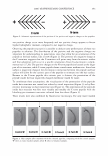
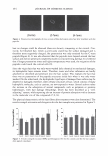
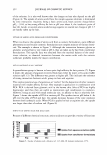
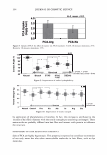
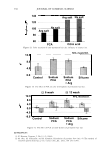
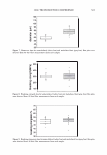
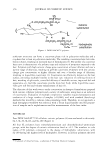
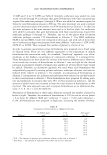
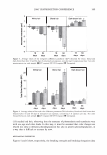
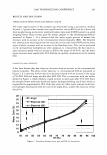
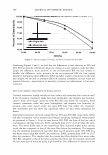
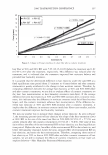
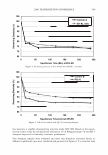
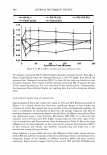
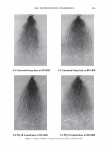
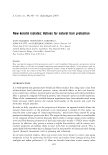
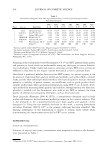
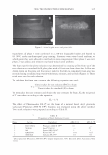
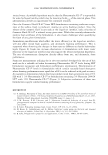
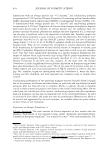
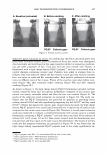
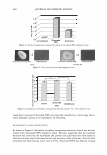
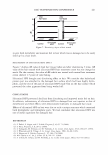
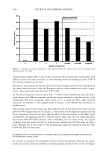
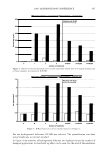
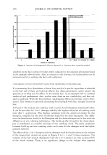
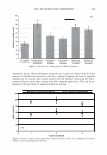
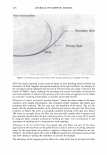
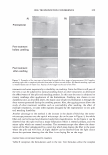
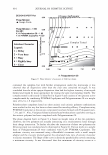
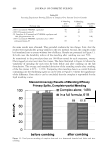
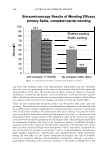
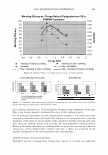
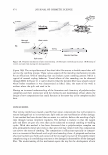
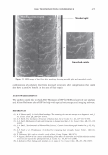
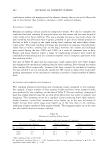
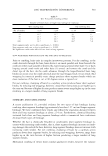
-40 -30 2006 TRI/PRINCETON CONFERENCE -20 -10 0 10 W:dth of he peak at an orde - Vai ,an,..,e of cuticle exposure 20 30 40 50 Shift angle (degrees) 307 Figure 13. A trace of the scattered light from a black Asian hair, taken with the 500 micron slit. We can now begin to see the diffraction grating behavior that our calculations imply. The broad background is the diffuse light and due to small irregularities. The "noise" about the diffraction peaks indicates variation in cuticle exposure. The spacing between the peaks is a measure of the mean cuticle exposure. While the relative heights of the diffraction peaks allows us to extract the cuticle thickness. -2.5 -2 -1.5 -1 -0.5 0 0.5 1.5 2 2.5 degrees Figure 14. We can scan through a diffracted line to yield an estimator for the impulse response of the optical system. This can be used to deconvolute the raw data from instrumental artifacts and thus obtain a measurement of the variance of cuticle exposure and thus cuticle breakage. COMP ARI SON WITH ST AND ARD METHODS It is a standard practice to derive the cuticle angle of tilt from light scattering data. The data are smoothed by fitting to a Gaussian. The centroid of the peak is often used to find the cuticle tilt angle. Geometrical optics implies that the measured shift in angle is twice this angle. It makes more sense to use a different definition for the center of the curve. Indeed a center of mass calculation suggests itself. We can find the area under the curve
Purchased for the exclusive use of nofirst nolast (unknown)
From: SCC Media Library & Resource Center (library.scconline.org)