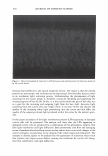
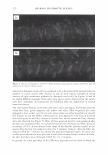
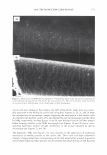
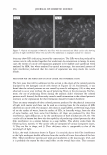
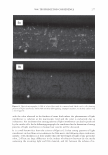
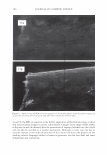
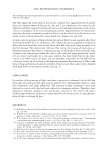
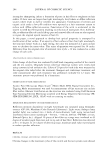
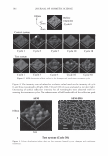
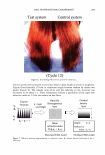
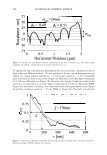
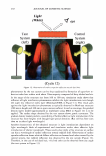
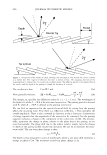
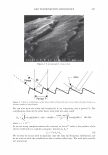
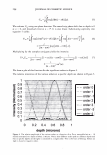
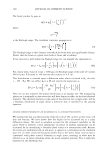
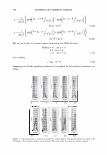
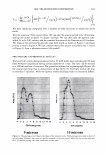
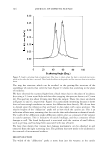
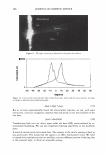
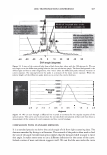
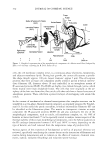
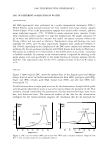
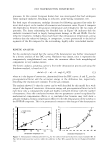
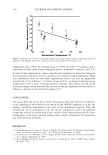
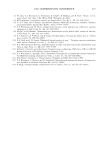
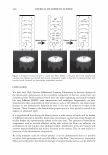
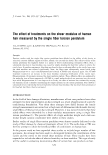
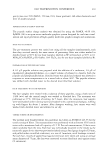
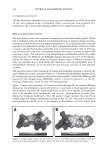
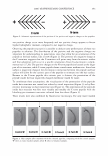
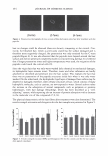
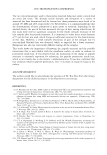
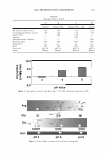
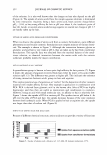
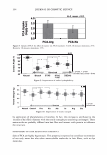
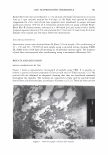
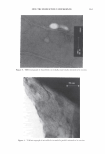
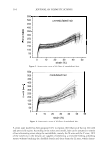
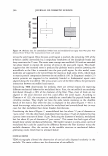
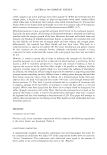
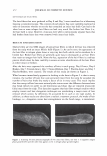
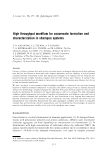
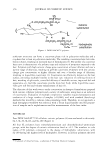
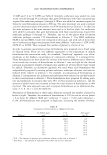
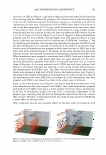
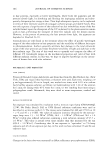
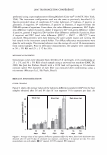
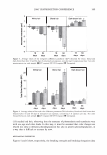
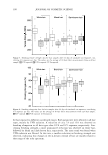
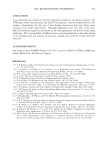
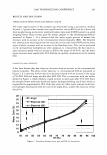
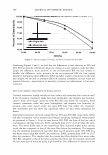
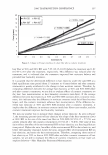
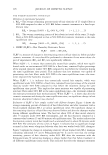
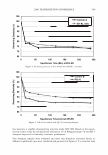
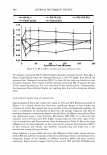
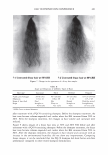
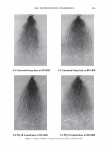
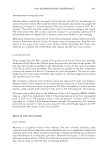
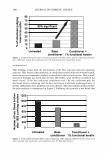
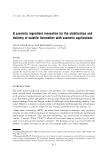
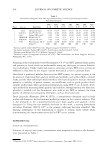
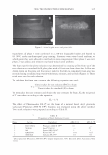
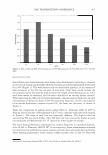
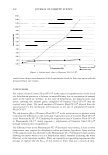
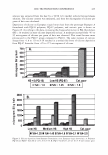
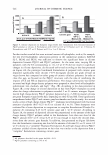
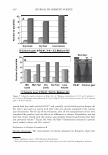
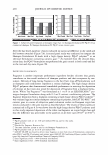
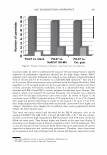
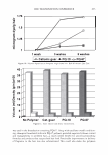
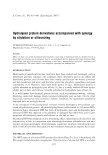
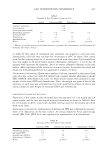
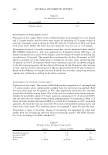
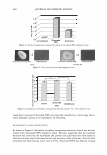
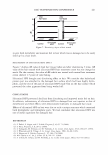
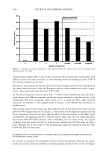
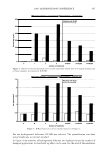
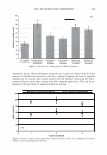
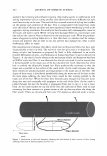
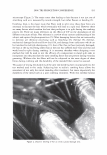
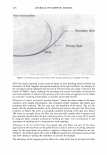
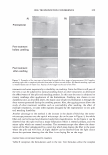
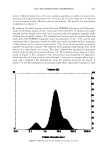
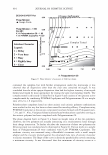
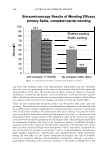
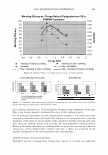
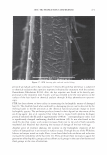
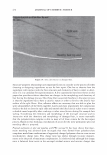
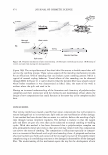
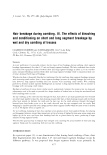
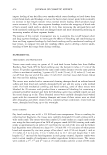
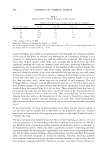
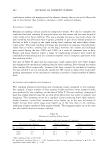
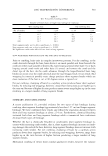
362 JOURNAL OF COSMETIC SCIENCE measuring about (2.8 x 2) µm and a few melanin granules. Also, holes made by the electron beam in the resin film show that these cavities belong to the structure of the medulla and are not artifacts by themselves. Some authors say that the medulla is in fact composed only of the vacuoles. However, as we observed vacuoles mixed with fibril structures (cortical cells) in all the samples, we consider that all of them are part of the structure of the medulla. Another interesting morphological aspect is the interface between cortex and medulla, shown in Figure 2. The interface is limited by a layer of CMC and empty spaces. The cortical cells become sparse and deformed. Figure 3 shows the microfibril pattern in the medulla/cortex interface (23). This micrograph shows the crystalline character of some cell material in the medulla. Figure 4 shows some microfibrils oriented parallel to the sectioned area, which indicates that cortical cells are randomly distributed. MECHANICAL PROPER TIES Typical stress-strain curves of unmedullated or medullated fibers are shown in Figure 5 and 6, respectively. The three main regions of a typical stress-strain curve of human hair, namely the elastic, yield and post-yield regions, are clearly identified. The initial elastic region extends roughly up to 2.5-4% strain. Here the load is taken by the hydrogen bonds establishing the alpha-helical microfibrils along with the matrix. As the hair is stretched to the yield region, the a-helices gradually transform into �-sheets and hair is no longer perfectly elastic (the transformation is complete at about 30% strain and the sheet structure itself exhibits some elasticity). The final phase of the stress-strain curve is the post-yield region where extended microfibrils take the entire load imposed on the hair before leading to complete fracture (24). This is the reason for the slope of the post-yield region being higher than the yield region. Figure 2. TEM micrograph cortex (C)/ medulla (M) interface.

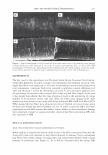
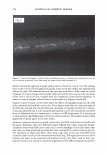
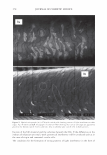
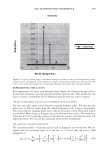
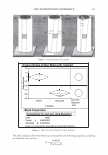
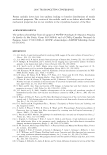
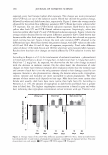
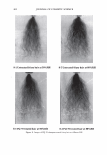
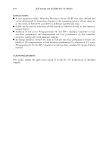
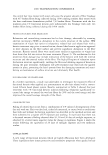
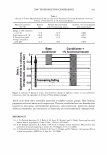
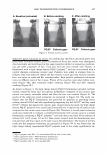
2006 TRI/PRINCETON CONFERENCE 363 Figure 3. TEM micrograph of microfibrils in medulla transversally oriented to he section. Figure 4. TEM micrograph of microfibrils in medulla parallel oriented to he section.
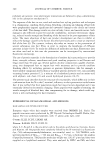
Purchased for the exclusive use of nofirst nolast (unknown)
From: SCC Media Library & Resource Center (library.scconline.org)