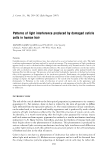
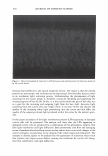
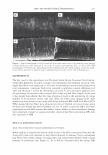
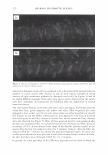
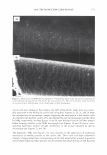
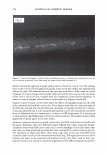
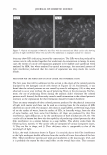
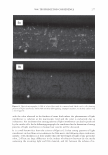
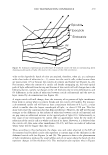
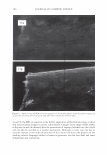
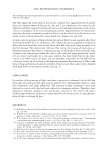
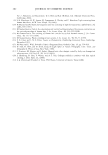
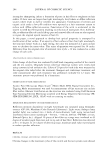
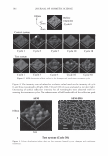
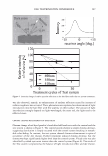
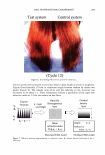
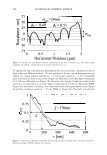
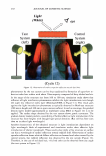
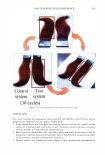
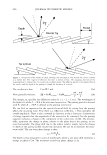
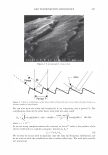
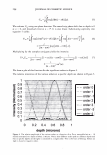
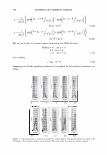
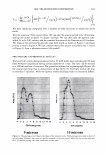
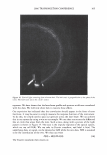
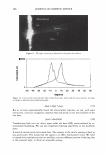
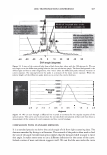
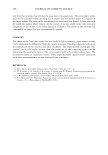
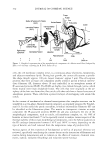
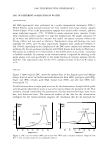
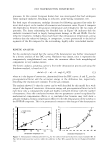
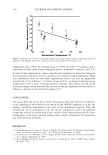
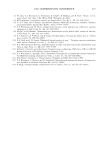
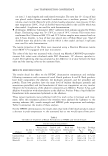
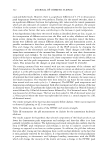
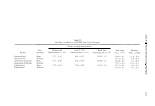
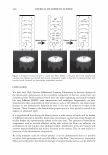
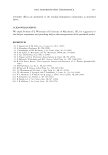
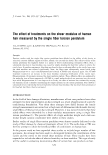
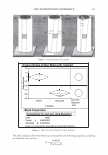
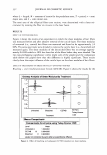
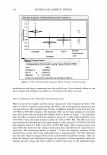
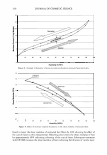
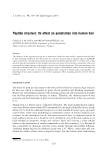
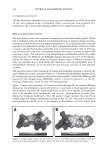
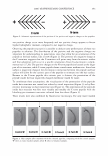
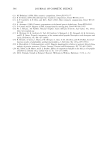
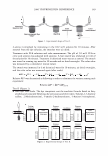
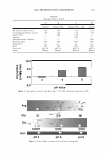
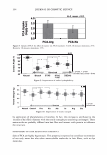
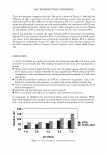
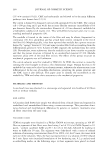
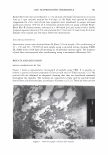
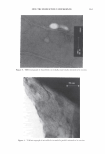
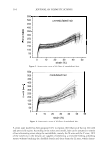
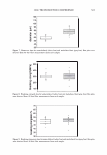
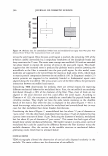
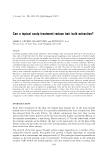
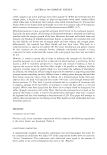
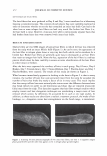
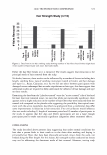
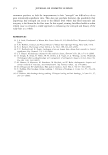
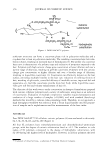
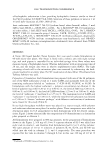
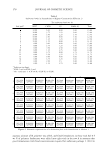
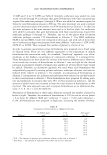
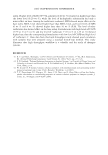
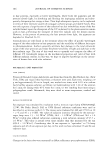
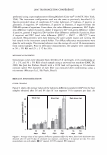
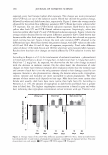
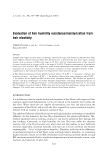
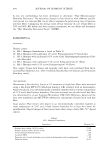
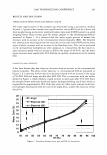
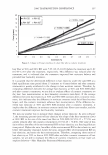
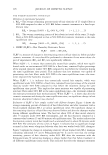
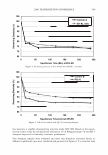
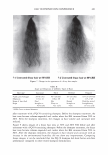
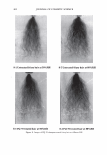
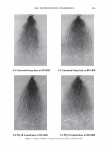
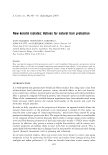
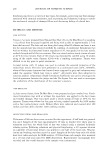
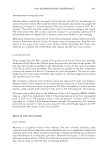
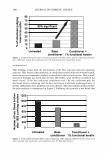
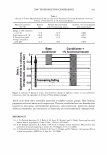
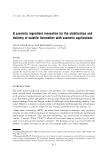
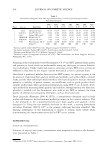
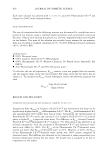
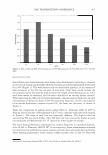
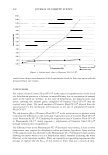
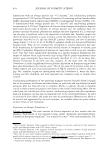
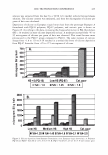
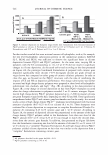
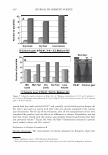
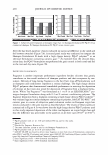
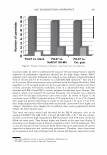
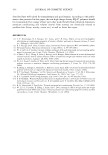
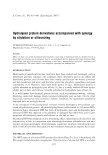
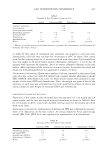
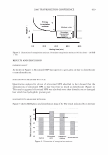
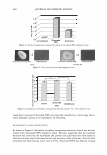
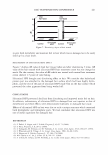
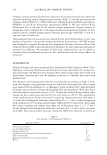
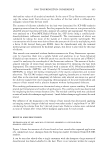
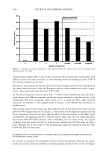
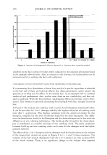
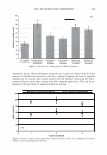
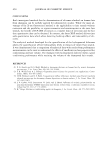
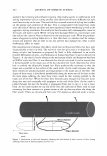
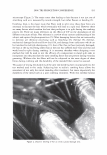
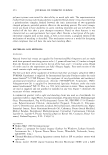
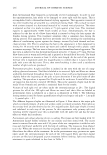
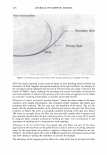
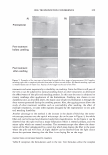
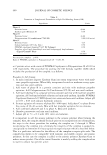
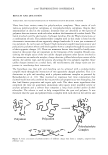
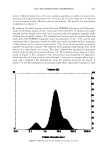
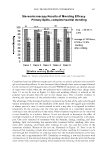
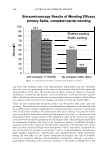
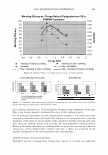
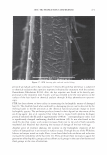
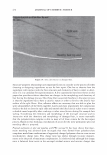
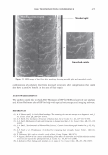
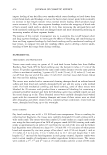
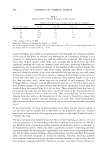
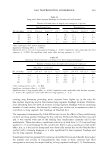
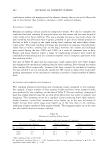
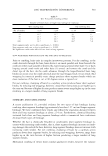
286 Control system Cycle I Test system Cycle I JOURNAL OF COSMETIC SCIENCE 100nm z l:2{nm X 2mm Cycle 3 Cycle 3 Cycle 5 Cycle5 Before treatment Cycle 0 Cycle 10 Cycle JO Cycle 30 Cycle 30 Figure 2. AFM observation of hair surface in the shampoo and conditioner treatment cycles. Figure 4. The intensity was calculated as a relative value based on the intensity of cycle 0, and three wavelengths oflight, 690, 5 50 and 410 nm were evaluated as incident light. Decreasing of surface reflection intensity for all wavelengths were observed with in- creasing the treatment cycles. No enhancement of half bandwidth of the reflection peak AFM SEM-EDS 100nm 0 Test system (Cycle 30) Figure 3. Silicon distribution (white dots) on fine structure formed by test shampoo and conditioner treatments.

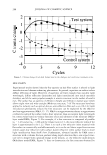
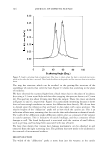
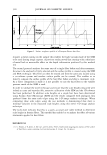
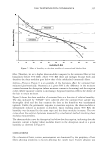
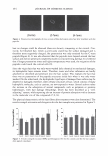
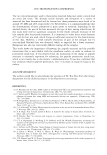
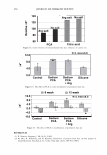
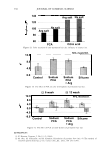
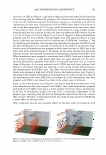
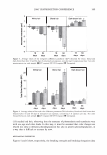
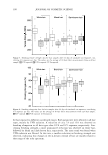
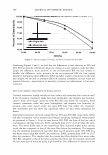
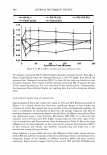
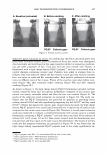
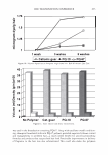
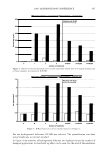
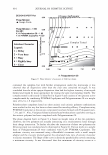
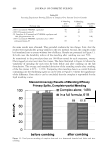
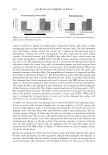
Dark room 120 100 80 60 40 20 0 2006 TRI/PRINCETON CONFERENCE 287 - - 300 200 -15 +15 receiver angle [deg.] 0 - �- -+- --•- -·la·- ,, . '- '· '', '- '- '- - ' , ......... ' ' ·, ' ' &. ' 690nm 550nm 410nm I ---. ............... -. ' ' ' ' ' ..,_ )\. I 0 5 30 Treatment cycles of Test system Figure 4. Intensity change of surface specular reflection on the hair fiber surface by test system treatments. was also observed, namely, no enhancement of random reflection caused by increase of surface roughness was occurred. These phenomena are explained as enhancement of light introduction into the hair fiber with fine asperity on their surface. The amount of light introduction strongly depends on light wavelength, the more red, the light tend to be reflected more. CHROMA CHANGE MEASUREMENT OF DYED HEAD Chroma change of red dyed panelist's head after half head tests with the control and the test system is shown in Figure 5. The control system showed a simple chroma decrease, suggesting dye elution is simply occurred with the control system resulting in remark- able color fading. In contrast, the test system showed chroma enhancement in spite of occurrence of the dye elution. Further treatment induced chroma decrease, but the chroma was kept significantly higher level than the control system. Visual color was also identified by naked eyes more intense than the control system (Figure 6). The result of the Test system is explained as the balance of light introduction effect and dye elution.
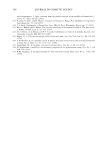
Purchased for the exclusive use of nofirst nolast (unknown)
From: SCC Media Library & Resource Center (library.scconline.org)