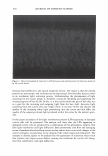
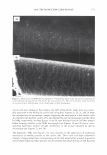
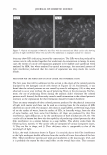
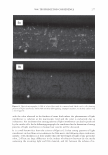
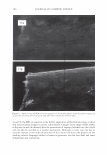
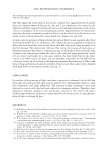
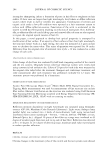
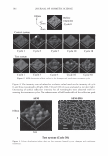
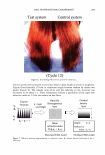
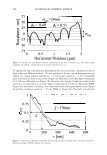
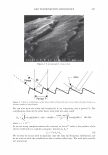
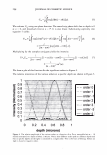
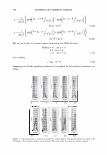
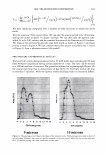
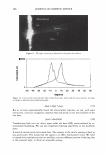
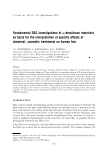
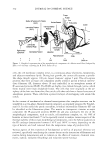
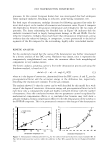
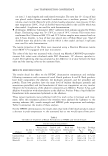
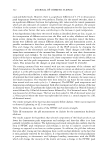
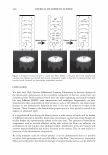
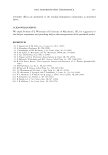
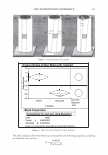
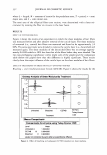
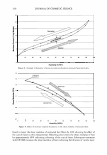
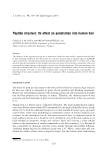
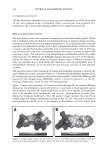
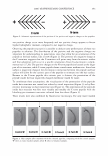
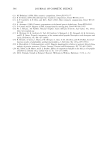
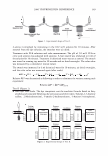
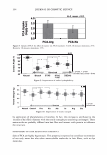
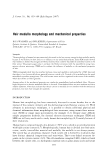
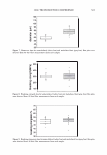
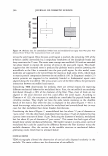
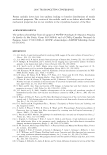
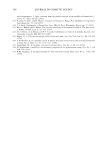
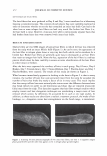
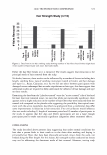
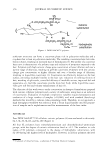
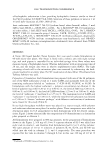
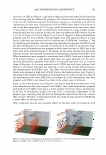
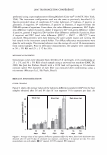
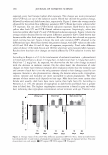
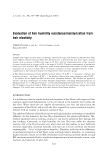
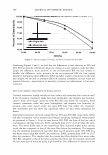
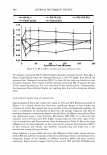
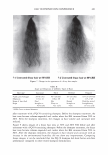
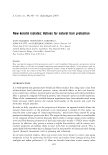
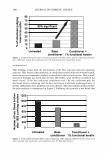
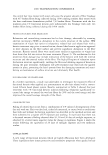
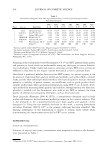
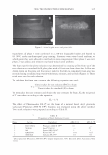
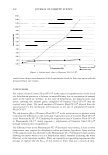
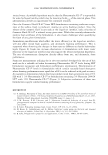
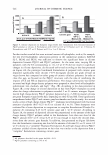
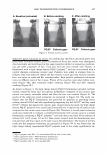
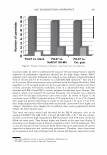
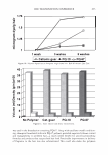
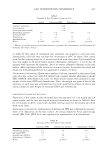
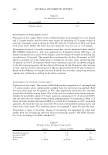
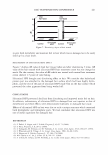
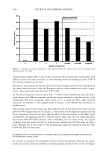
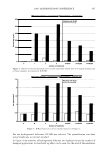
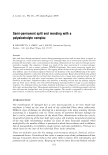
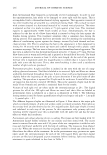
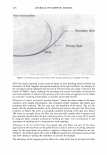
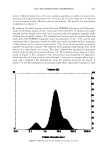
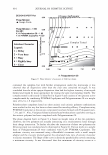
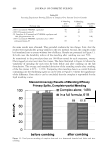
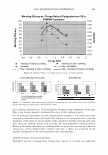
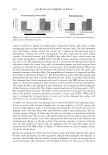
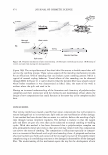
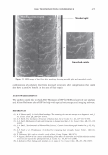
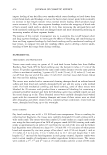
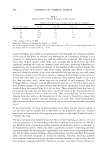
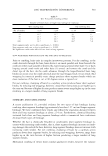
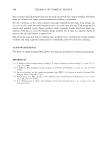
2006 TRI/PRINCETON CONFERENCE 463 solvent. Stability shows that a 4% active complex dispersion is stable at elevated tem- peratures and multiple freeze thaw cycles. The particles are in the range of 5-10 microns in size as measured with a Malvern particle size analyzer. The particle size distribution is illustrated in Figure 8. By studying the phase diagram formed between PVM/MA Copolymer and Polyquater- nium-28 the phase regions of their interactions were identified. In building this phase diagram various weight ratios were used in putting the two polymers together while keeping other variables constant. The variables kept constant were the solvent which was water, pH of the PVM/MA Copolymer which was adjusted to 7 .00 ± 0.05, and the type of polymer which inherently controls the molecular weight and other intrinsic properties of the polymers such as cationic charge density. The process of putting the two polymers together was also kept constant. The character of the polymer combinations were noted and given a value against set criteria. The phase diagram was produced by regression analysis with the help of statistical software (15 ). The resultant phase diagram is illus- trated in Figure 9. The complexes were characterized macroscopically by appearance where the value of 5 was given to clear solutions, 1 was given to opaque white disper- sions, and 2 through 4 for intermediate values for solution characters see legend in Figure 9. It was first thought that the opaque milky white dispersions designated 1 only Yablefl') .-�-,.._ ................ .....-----1 1.D mo "DI.II '11111..D Figure 8. Malvern particle size analysis of microgel structure. 'I) D

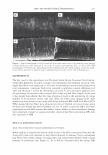
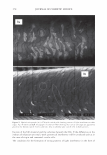
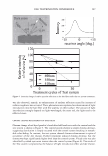
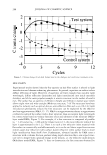
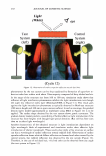
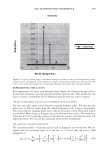
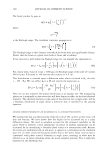
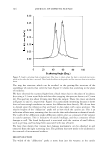
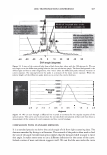
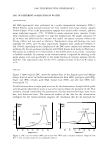
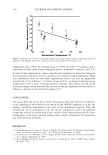
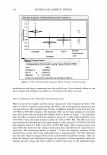
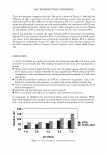
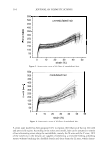
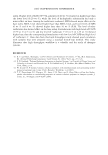
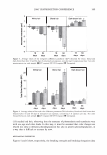
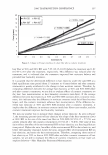
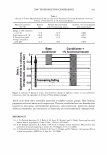
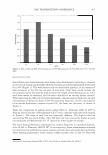
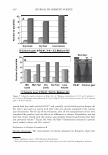
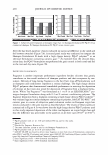
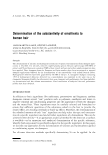
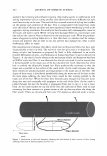
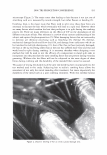
464 JOURNAL OF COSMETIC SCIENCE DESIGN-EXPERT Plot Phase Behavior • Design Points Phase Behavior = 1.564 Run #81 0.50 0.38 X: A: Polyquatemium-28 = 1.80 Y: 8: PVM/MA Copolymer = 0.20 Solution Character Legend: 1 = Milky 2 = Very hazy 3 = Hazy 4 = Slightly hazy 5 = Clear ... C1I E , o 0.25 i � ci::i 0.13 0.00 0.00 2.44 • • • • • Complex Tested • • 4.88 7.31 A: Polyquatemium-28 Figure 9. Phase behavior of polymers of differing charge. • • • • 9.75 contained the complex, but with further investigation under the microscope it was observed that all dispersions other than the clear ones contained microgels. It was concluded that the white opaque dispersions then had the highest intensity of microgels formed and would be most appropriate for testing the split end mending benefit. The complex tested in this study is identified in Figure 9 and consists of two percent active complex made by combining PVM/MA Copolymer and Polyquaternium-28 at a weight ratio of 0.2 to 1.8 respectively. Polyelectrolyte complexes based on other anionic and cationic polymer combinations were studied in this way but have not been tested for mending efficacy. Complexes using PVM/MA Copolymer as the anionic component have been formed with Polyquaternium- 7, 10, and 11. Also, Vinylpyrrolidone/acrylates/laurylmethacrylate copolymer serving as the anionic polymer has been complexed with Polyquaternium-28. The phase diagram built in Figure 9 is based on weight ratios of the two polymers. However, the two polymers are actually interacting on a stoichiometric basis through their charge interaction. To further elucidate the interaction of these two polymers the following study was conducted and is illustrated in Figure 10. Various levels on a weight basis of Polyquaternium-28 were combined with 0.2% PVM/MA Copolymer. The resultant viscosity was measured using a Brookfield viscometer with a small sample adapter and the viscosity plotted against the calculated mole ratio of cationic monomer to anionic monomer. The shape of the curve is distinctly parabolically curved containing a minimum viscosity. It was discovered that this minimum of viscosity occurs at a
Purchased for the exclusive use of nofirst nolast (unknown)
From: SCC Media Library & Resource Center (library.scconline.org)