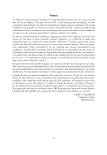
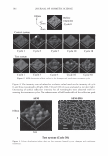
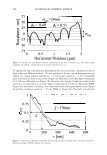
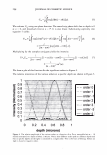
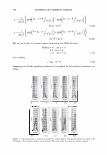
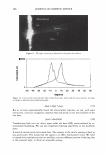
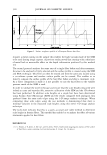
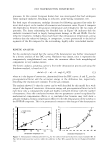
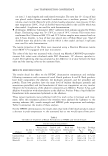
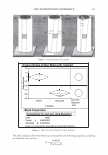
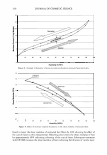
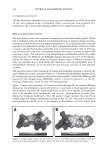
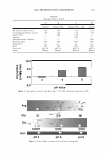
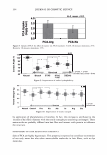
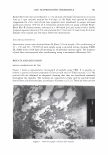
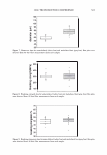
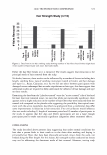
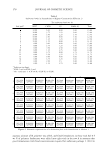
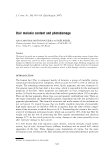
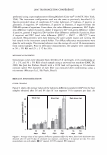
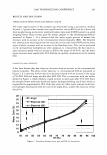
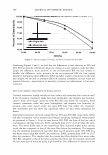
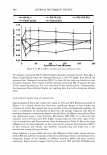
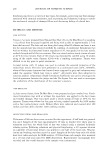
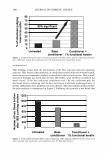
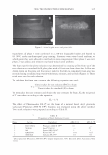
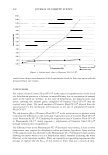
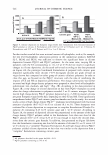
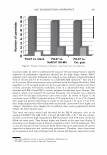
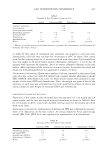
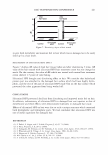
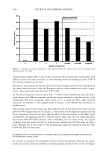
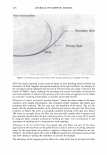
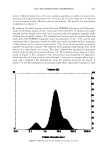
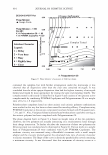
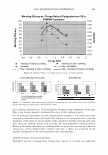
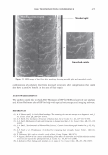
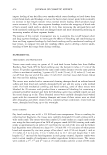
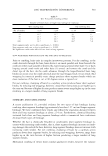
314 JOURNAL OF COSMETIC SCIENCE enthalpy is largely material invariant (7). Assigning the enthalpy exclusively to the denaturation of the helical material, leads to the conclusion that thus also the helix content for these materials is largely the same, estimated to be 25-30%, in accordance with literature data (8). In contrast, the denaturation temperature TO increases strongly with the cross-link density of the matrix, which is effected by the double amino acid cystine linking two protein chains. The results are summarized in Figure 3. Regression analysis shows that for the majority of the keratins a linear model well describes the interrelation between T O and Cys-R. The solid line in Figure 3 is based on all T 0-values, except those for rhino horn, which due to its low amount of matrix material appears to be an exception. Using a log(Cys-R)-relationship the values for RH may be readily included (7). From Figure 3 it can be concluded that, though the denaturation enthalpy and the temperature range in which the denaturation takes place are material invariant, the thermal stability of the helical structures, i.e. the denaturation temperature, is controlled by the amount and the cross-link density of the surrounding non-helical matrix material. This view is supported by investigations of the double peak structure of the DSC-curves, consistently observed namely for Merino wool. It was shown that the effect is due to the occurrence of two cell types in the fiber, ortho- and para-cortical cells, which differ significantly in the sulfur content of their IFAPs, consistent with the observed bimo- dality of the denaturation temperature (11). Increasing the heating rate, leads to an increase in T 0. The size of the effects is, however, quite different for the two cell types (12). EFFECTS OF OXIDATION AND REDUCTION Against this fundamental background, DSC was found to be especially suitable to assess various aspects of the changes filaments and matrix undergo through chemical, cosmetic 160 150 LI 140 0 ::, 130 - E 120 � 110 100 HH � MO WO �NH PC 8 i� l�o I ---------- FN o Ea RH 0 0 T0 vs. Cys-R sl o:: 1.45 0 ic" 121..5 8 r2:: 0.72 n " 56 6 8 10 12 14 16 Cys-R, [mol¾l 18 Figure 3. Denaturation temperature TD for single peak endotherms against Cys-R content. The solid line describes the linear regression through all data, except for rhinoceros horn (RH). The parameters for the linear regression are given (Adapted from Ref. 7).

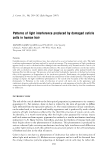
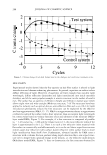
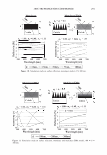
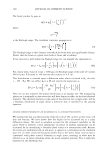
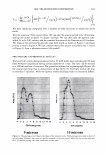
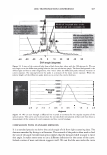
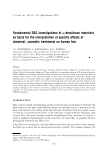
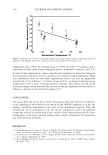
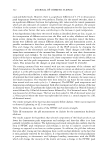
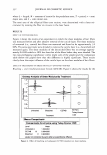
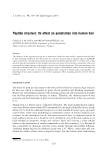
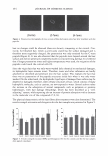
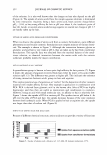
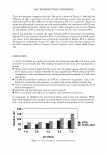
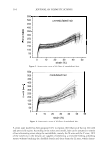
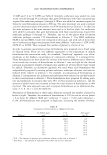
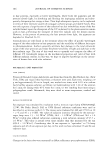
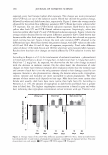
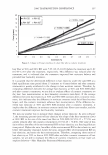
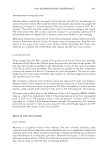
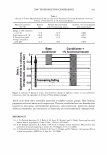
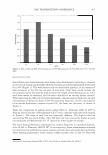
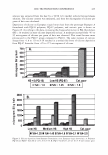
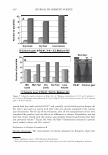
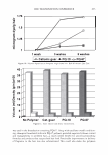
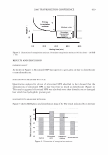
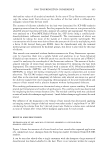
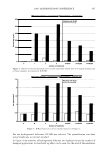
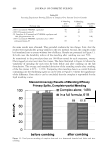
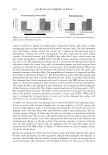
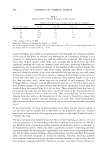
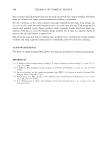
2006 TRI/PRINCETON CONFERENCE 315 processes. In this context European human hair was investigated that had undergone either multiple oxidative, bleaching or reductive, perm-waving treatments (13). For both types of treatments, enthalpy decreases by following apparent first-order ki- netics with respect to the number of treatments and treatment times. Figure 4 compares the dependencies between denaturation temperature and enthalpy for the two types of processes. The linear relationship for bleached hair in Figure 4A indicates that the oxidative treatment leads to largely homogeneous damage in IFs and IFAPs. For the reductive treatment, enthalpy drops much faster than denaturation temperature, giving evidence that the reductive damage, in comparison, is more pronounced in the helical segments of the IFs compared to the surrounding, highly sulfur cross-linked matrix. KINETIC ANALYSIS For the oxidatively treated hair the course of the denaturation was further investigated by a kinetic analysis of the DSC-curves. Oxidation was chosen, since it represents the comparatively straightforward case, where the treatment affects both morphological components to very similar extents. The kinetic analysis, assuming a priori a first-order denaturation process and using the Friedman-method, is based on (14): daldt= (l - a)· A· exp(-E A IRT) (1) where a is the degree of conversion, determined from the DSC-curves. A and EA are the pre-exponential factor and the activation energy in the Arrhenius law, respectively, describing the reaction rate constant. R is the gas constant. The analysis shows ( 15) that the curves can be well described by this model for a wide range of the degree of conversion. Activation energy and pre-exponential factor (as lnA) each show only a comparatively small and highly correlated decrease with the number of treatments. Since the correlation between the two parameters cannot be explained by mathematical compensation effects, it is concluded that keratins may well show a genuine enthalpy-entropy compensation effect (16) for the denaturation of the a-helix in the IF/IFAP composite. This is in pronounced contrast to the change of the denaturation 22 18 � .? 16 """) 20 y = -33.6 + 0.33 X • ·= """) r::: 0.96 .: 14 18 , 12 ia -$ .i::. 10 C: 16 w C: 0 14 :8 6 E • l! .a � 4 (1l 12 A C: C: Cl) 2 ii) Q Cl 10 0 135 140 145 150 155 160 110 115 120 125 130 135 140 145 150 155 160 Denaturation Temperature in •c Denaturation Temperature in 'C Figure 4. Denaturation enthalpy plotted vs TD for the oxidized (A) and reductively treated samples (B). In Fig. 4A the regression line is given, while the solid line in Fig. 4B is a guide for the eye (Adapted from Ref. 13).
Purchased for the exclusive use of nofirst nolast (unknown)
From: SCC Media Library & Resource Center (library.scconline.org)