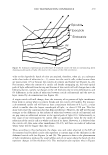
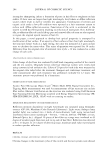
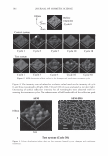
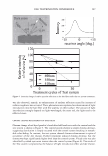
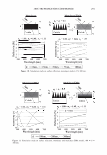
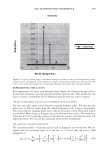
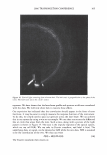
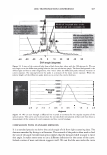
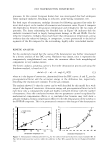
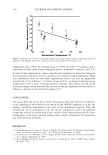
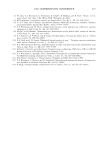
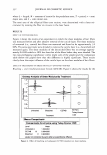
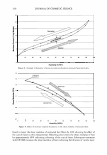
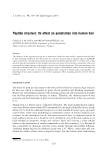
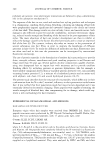
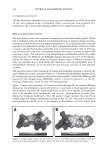
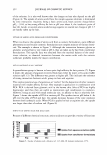
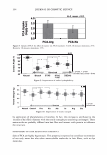
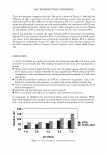
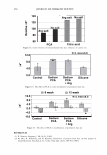
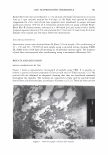
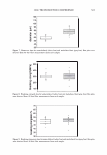
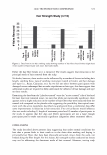
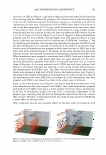
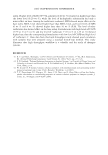
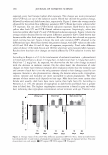
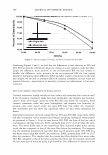
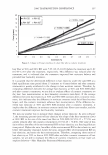
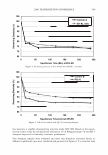
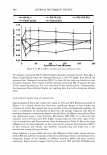
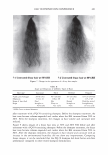
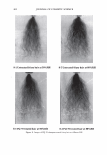
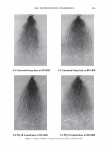
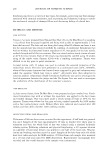
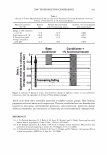
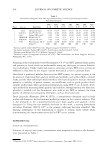
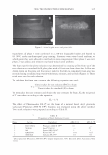
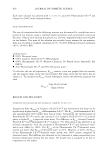
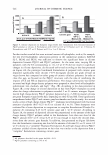
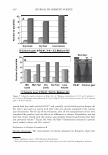
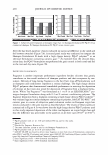
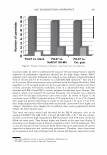
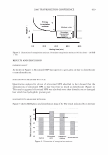
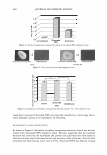
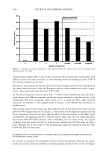
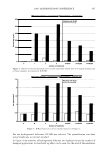
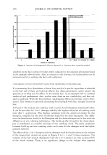
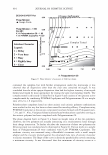
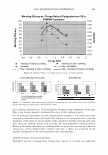
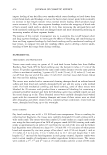
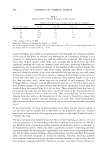
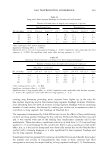
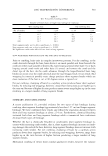
2006 TRI/PRINCETON CONFERENCE 381 and 10 wt % SLES at dilution 1, and each of those sections was further divided into four slices showing data for different SL polymers. The dilution level is indicated along the Z-axis. In this 3D framework each formulation is shown as a small ball with the color representing the haze level. Formulations with the RNU values below 10 are shown in red, in the haze range from 10-15 in grey, while formulations with haze values above 15 are shown in blue. In order to allow better visualization of a large number of data, formulations from this study are divided into three sets where the SLES level at dilution 1 is 6 wt % (Figure 4), 8 wt % (Figure 5 ), or 10 wt % (Figure 6). Among formulations prepared with low level of SLES-3 mol and higher level of SL polymers (Figure 4, right figure), high haze was observed with all combinations of CAPB and "surfactant 3" and in a broad range of dilutions. The corresponding formulations prepared with SLES-2 mol also showed high haze, but it typically occurred only in the middle of the dilution range. Another series of formulations was prepared with the same low level of SLES, but at the lower level of SL polymers (Figure 4, left figure). In this series the haze was drastically reduced, and this was especially pronounced in formulations prepared with SLES-2 mol. When formulations were prepared at a moderate level of SLES-3 mol and at higher level of SL polymer (Figure 5, right figure) high haze was again observed, but the corre- sponding formulations prepared with SLES-2 mol showed high haze only in a narrow range of dilutions. At the same moderate level of SLES and with lower polymer level (Figure 5, left figure) high haze was observed in only a small number of formulations, and predominantly with SLES-3 mol. This effect was even more obvious when formu- lations were prepared at high level of SLES. Even at the higher polymer level (Figure 6, right figure) the number of formulations with high haze was reduced relative to that for the formulations with lower SLES level, and almost all of the formulations that were prepared with SLES-2 mol showed low haze in the whole range of dilutions. Again, at the lower polymer level (Figure 6, left figure) high haze was observed in only a few formulations that were prepared with SLES-3 mol, while formulations prepared with high level of SLES-2 mol and at a lower polymer level were clear at all dilutions. In all sets of formulations studied, the haze level is essentially independent of the polymer type, indicating that the level of hydrophobic substitution has only a minor effect on haze. Therefore, in formulations from this study the type and level of SLES had a major effect on the haze index. Other surfactants showed only moderate effects on the haze index. Formulations with Figure 4. Haze values of formulations prepared with polymers at 0.2 wt % (left figure) or 0.4 wt % (right figure) and SLES-2 mol or SLES-3 mol at 6 wt % at dilution 1.

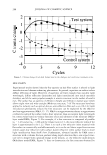
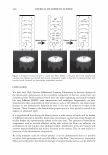
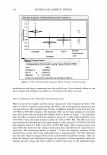
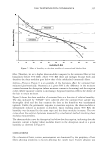
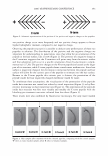
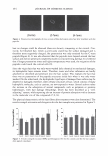
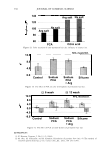
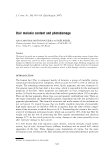
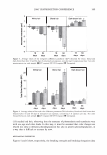
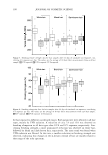
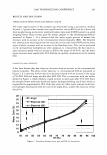
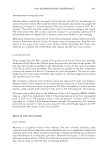
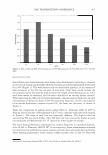
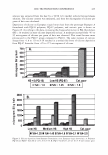
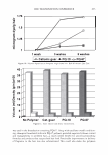
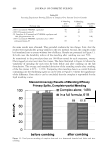
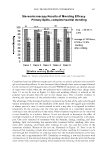
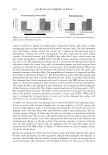
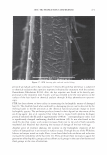
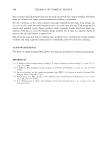
382 JOURNAL OF COSMETIC SCIENCE Figure 5. Haze values of formulations prepared with polymers at 0.2 wt % (left figure) or 0.4 wt % (right figure) and SLES-2 mol or SLES-3 mol at 8 wt % at dilution l. Figure 6. Haze values of formulations prepared with polymers at 0.2 wt % (left figure) or 0.4 wt % (right figure) and SLES-2 mol or SLES-3 mol at 10 wt % at dilution 1. high level of CAPB (3.75 wt % or 5 wt %) and low level of "surfactant 3" (0 or 1.25 wt % ) showed higher haze than the corresponding formulations with low level of CAPB and high level of "surfactant 3". The level of SoftCAT™ SL polymers also showed a moderate effect on haze, with higher polymer level resulting in higher haze. However, the type of a polymer had a negligible effect on haze, suggesting that small differences in the level of hydrophobic substitution are not critical in formation of coacervates. Selected formulations from this study were also prepared using a standard (bench-top) method. Water was added to formulations that were prepared at dilution 1 to give dilutions 6 and 8. Haze data for those samples were essentially identical (within the limits of experimental error) to haze values of formulations from the high-throughput study. This result further confirms the applicability of high throughput workflow for study of coacervate formation in shampoo systems. CONCLUSIONS In this study of coacervate formation in shampoo systems, a high throughput workflow was developed for the preparation of formulations with different types and levels of cationic cellulosic polymers and surfactants, and for measurement of their haze values. Our results provide information on the effect of formulation components on the haze
Purchased for the exclusive use of nofirst nolast (unknown)
From: SCC Media Library & Resource Center (library.scconline.org)