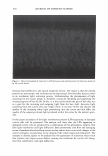
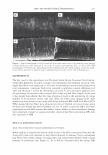
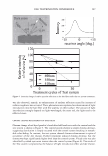
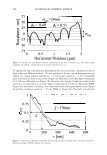
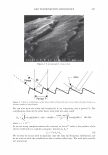
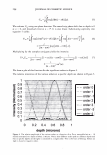
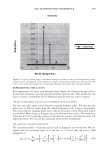
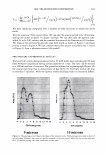
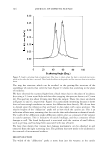
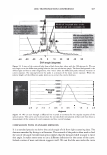
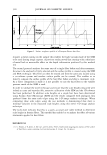
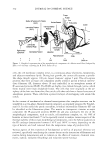
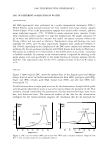
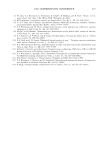
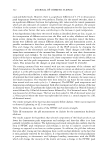
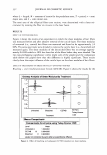
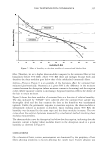
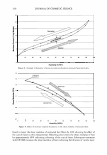
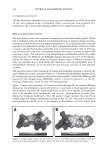
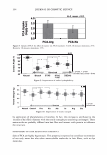
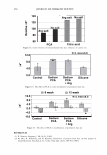
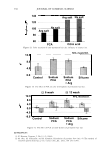
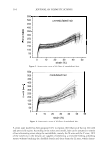
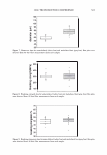
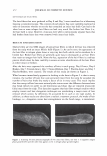
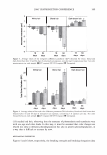
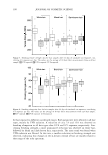
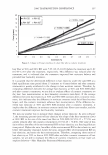
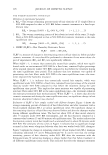
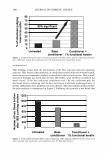
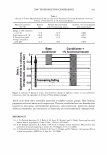
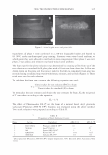
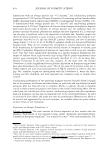
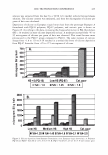
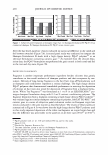
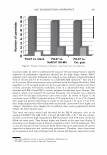
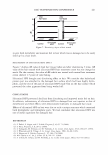
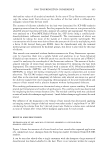
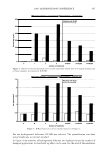
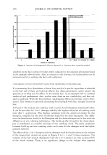
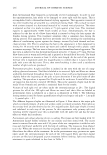
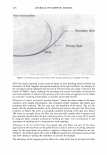
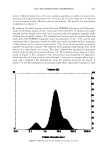
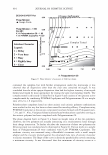
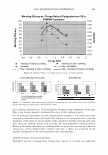
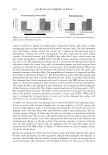
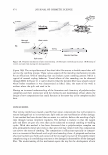
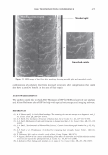
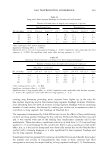
-40 -30 2006 TRI/PRINCETON CONFERENCE -20 -10 0 10 W:dth of he peak at an orde - Vai ,an,..,e of cuticle exposure 20 30 40 50 Shift angle (degrees) 307 Figure 13. A trace of the scattered light from a black Asian hair, taken with the 500 micron slit. We can now begin to see the diffraction grating behavior that our calculations imply. The broad background is the diffuse light and due to small irregularities. The "noise" about the diffraction peaks indicates variation in cuticle exposure. The spacing between the peaks is a measure of the mean cuticle exposure. While the relative heights of the diffraction peaks allows us to extract the cuticle thickness. -2.5 -2 -1.5 -1 -0.5 0 0.5 1.5 2 2.5 degrees Figure 14. We can scan through a diffracted line to yield an estimator for the impulse response of the optical system. This can be used to deconvolute the raw data from instrumental artifacts and thus obtain a measurement of the variance of cuticle exposure and thus cuticle breakage. COMP ARI SON WITH ST AND ARD METHODS It is a standard practice to derive the cuticle angle of tilt from light scattering data. The data are smoothed by fitting to a Gaussian. The centroid of the peak is often used to find the cuticle tilt angle. Geometrical optics implies that the measured shift in angle is twice this angle. It makes more sense to use a different definition for the center of the curve. Indeed a center of mass calculation suggests itself. We can find the area under the curve

308 JOURNAL OF COSMETIC SCIENCE and find the location that divides the area into two equal parts. This procedure works well on the simulated data, arriving at tilt angles that are within about 0.2 degrees of the input values. The error in the estimator is not statistical, but biased. It does not work for small tilt angles where almost all the energy is in the zeroth order (the intensity weighting of the orders is not linear function of depth). The errors in the estimate are comparable to those that are experimentally quoted. SUMMARY The shape of the "specular" peak that one finds in light scattering experiments on hair can be explained by diffraction from the cuticle structure. The shape depends both upon the periodicity of the cuticles and their thickness. The experimental techniques that extract cuticle tilt angles assume that the positions of the scattering peaks can be determined by geometric optics. This is not supported by the analysis given here. The assumption leads to systematic errors. These experimentally quoted errors associated with these measurements are not statistical but systematic. REFERENCES (1) M. V. Klein, Optics Qohn Wiley & Sons, New York, 1970), pp. 338-349. (2) W. R. Roach, C. B. Carroll, A. R. Firester, I. Gorog, and W. Wagner, Diffraction spectrometry for videodisk quality control, RCA Review, 39(3) 272 (1978). (3) J. W. Goodman, Introduction to Fourier Optics (McGraw-Hill, New York, 1968). (4) J. T. Moon and S. R. Marschner, Scattering in hair using a photon mapping approach, Tranaction on Graphics, 25, 3 (Proceedings of SIGGRAPH 2006).
Purchased for the exclusive use of nofirst nolast (unknown)
From: SCC Media Library & Resource Center (library.scconline.org)